Download
1 / 2
20 likes | 182 Views
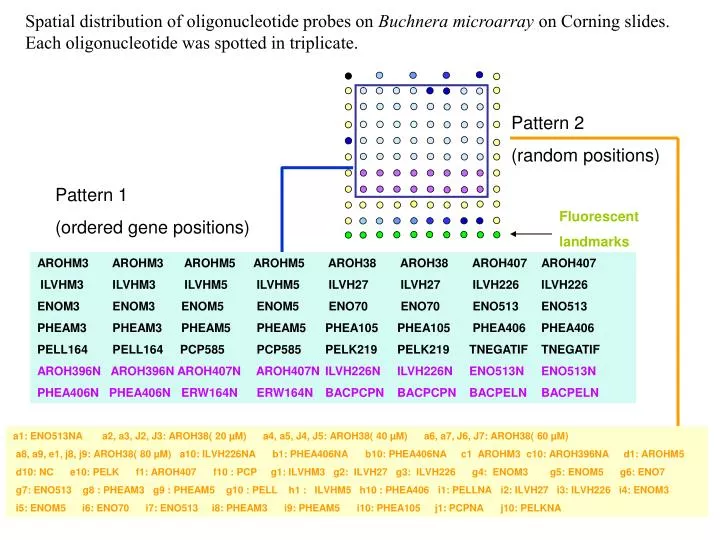
Spatial distribution of oligonucleotide probes on Buchnera microarray on Corning slides. Each oligonucleotide was spotted in triplicate. Pattern 2 (random positions). Pattern 1 (ordered gene positions). Fluorescent landmarks.

E N D
Spatial distribution of oligonucleotide probes on Buchnera microarray on Corning slides. Each oligonucleotide was spotted in triplicate. Pattern 2 (random positions) Pattern 1 (ordered gene positions) Fluorescent landmarks AROHM3 AROHM3 AROHM5 AROHM5 AROH38 AROH38 AROH407 AROH407 ILVHM3 ILVHM3 ILVHM5 ILVHM5 ILVH27 ILVH27 ILVH226 ILVH226 ENOM3 ENOM3 ENOM5 ENOM5 ENO70 ENO70 ENO513 ENO513 PHEAM3 PHEAM3 PHEAM5 PHEAM5 PHEA105 PHEA105 PHEA406 PHEA406 PELL164 PELL164 PCP585 PCP585 PELK219 PELK219 TNEGATIF TNEGATIF AROH396N AROH396N AROH407N AROH407N ILVH226N ILVH226N ENO513N ENO513N PHEA406N PHEA406N ERW164N ERW164N BACPCPN BACPCPN BACPELN BACPELN a1: ENO513NA a2, a3, J2, J3: AROH38( 20 µM) a4, a5, J4, J5: AROH38( 40 µM) a6, a7, J6, J7: AROH38( 60 µM) a8, a9, e1, j8, j9: AROH38( 80 µM) a10: ILVH226NA b1: PHEA406NA b10: PHEA406NA c1 AROHM3 c10: AROH396NA d1: AROHM5 d10: NC e10: PELK f1: AROH407 f10 : PCP g1: ILVHM3 g2: ILVH27 g3: ILVH226 g4: ENOM3 g5: ENOM5 g6: ENO7 g7: ENO513 g8 : PHEAM3 g9 : PHEAM5 g10 : PELL h1 : ILVHM5 h10 : PHEA406 i1: PELLNA i2: ILVH27 i3: ILVH226 i4: ENOM3 i5: ENOM5 i6: ENO70 i7: ENO513 i8: PHEAM3 i9: PHEAM5 i10: PHEA105 j1: PCPNA j10: PELKNA
Spatial distribution of oligonucleotide probes on Buchnera microarray on RosaTech slides. Each oligonucleotide was spotted in triplicate. Pattern 2 (random positions) Pattern 1 (ordered gene positions) Fluorescent landmarks AROHM3 AROHM3 AROHM5 AROHM5 AROH38 AROH38 AROH407 AROH407 ILVHM3 ILVHM3 ILVHM5 ILVHM5 ILVH27 ILVH27 ILVH226 ILVH226 ENOM3 ENOM3 ENOM5 ENOM5 ENO70 ENO70 ENO513 ENO513 PHEAM3 PHEAM3 PHEAM5 PHEAM5 PHEA105 PHEA105 PHEA406 PHEA406 PELL164 PELL164 PCP585 PCP585 PELK219 PELK219 TNEGATIF TNEGATIF a1 : AROH407 a3, h2, h3: AROH38( 20 µM) a5, h4, h5: AROH38( 40 µM) a7 h6, h7: AROH38( 60 µM) a9, e1, h8, h9: AROH38( 80 µM) c1: AROHM3 c10: PHEA105 d1: AROHM5 d10: NC e10: PELK f10: PCP g1: ILVHM3 g2 : ILVH27 g3 : ILVH226 g4: ENOM3 g5: ENOM5 g6: ENO7 g7: ENO513 g8: PHEAM3 g9: PHEAM5 g10: PELL h1 : ILVHM5 h10: PHEA406