Download
1 / 2
20 likes | 213 Views
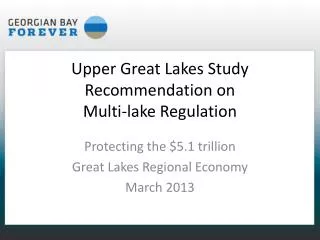
Developing Multi-Lake Regulation Plans for the Great Lakes through Multi-Scenario Optimization. Saman Razavi, Bryan A. Tolson, and Masoud Asadzadeh Dept. of Civil & Environmental Engineering, University of Waterloo. OPTIMIZATION RESULTS

E N D
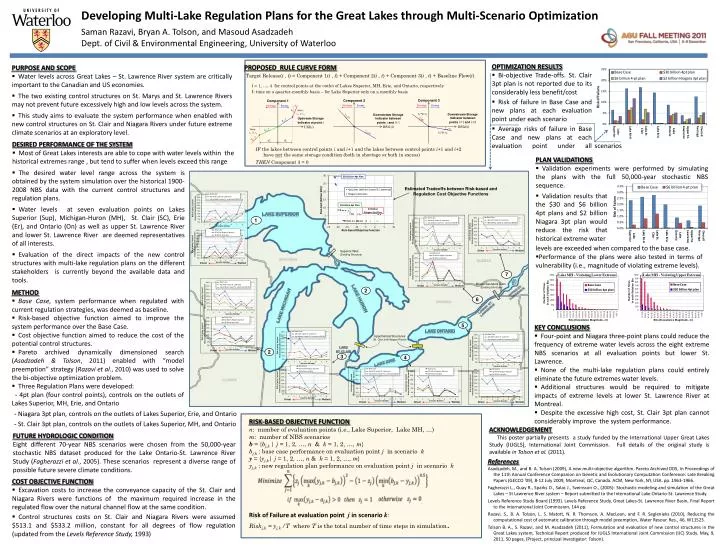
Developing Multi-Lake Regulation Plans for the Great Lakes through Multi-Scenario Optimization Saman Razavi, Bryan A. Tolson, and Masoud AsadzadehDept. of Civil & Environmental Engineering, University of Waterloo • OPTIMIZATION RESULTS • Bi-objective Trade-offs. St. Clair 3pt plan is not reported due to its considerably less benefit/cost • Risk of failure in Base Case and new plans at each evaluation point under each scenario • Average risks of failure in Base Case and new plans at each evaluation point under all PROPOSED RULE CURVE FORM • PURPOSE AND SCOPE • Water levels across Great Lakes – St. Lawrence River system are critically important to the Canadian and US economies. • The two existing control structures on St. Marys and St. Lawrence Rivers may not prevent future excessively high and low levels across the system. • This study aims to evaluate the system performance when enabled with new control structures on St. Clair and Niagara Rivers under future extreme climate scenarios at an exploratory level. Target Release(i , t) = Component 1(i , t) + Component 2(i , t) + Component 3(i , t) + Baseline Flow(i) i = 1, …, 4 for control points at the outlet of Lakes Superior, MH, Erie, and Ontario, respectively t: time on a quarter-monthly basis – for Lake Superior only on a monthly basis USI(i) Single-scenario Optimization Results Component 1 Component 3 Component 2 • DESIRED PERFORMANCE OF THE SYSTEM • Most of Great Lakes interests are able to cope with water levels within the historical extremes range , but tend to suffer when levels exceed this range 1 Shortage Excess scenarios Shortage Excess Shortage Excess s3 Note: s3≥s1 IF the lakes between control points i and i+1 and the lakes between control points i+1 and i+2 have not the same storage condition (both in shortage or both in excess) THEN Component 3 = 0 s7=p.s5 Downstream Storage Indicator between points i+1 and i+2 Downstream Storage Indicator between points i and i+1 1 s5 Upstream Storage Indicator at point i 1 1 s7 • PLAN VALIDATIONS • Validation experiments were performed by simulating the plans with the full 50,000-year stochastic NBS sequence. s1 s8 1 1 s2 Note: s4≥s2 1 s8=p.s6 • The desired water level range across the system is obtained by the system simulation over the historical 1900-2008 NBS data with the current control structures and regulation plans. • Water levels at seven evaluation points on Lakes Superior (Sup), Michigan-Huron (MH), St. Clair (SC), Erie (Er), and Ontario (On) as well as upper St. Lawrence River and lower St. Lawrence River are deemed representatives of all interests. • Evaluation of the direct impacts of the new control structures with multi-lake regulation plans on the different stakeholders is currently beyond the available data and tools. s6 2 1 s4 d2 d1 • Validation results that the $30 and $6 billion 4pt plans and $2 billion Niagara 3pt plan would reduce the risk that historical extreme water Estimated Tradeoffs between Risk-based and Regulation Cost Objective Functions 4 Lake Superior 3 5 2 6 1 7 MICHIGAN QUEBEC • levels are exceeded when compared to the base case. • Performance of the plans were also tested in terms of vulnerability (i.e., magnitude of violating extreme levels). Superior Weir (Existing Structure) WISCONSIN ONTARIO Driest Wettest Driest Wettest Driest Wettest Driest Wettest Driest Wettest Driest Wettest Driest Wettest Driest Wettest Moses Saunders Dam (Existing Structure) • METHOD • Base Case, system performance when regulated with current regulation strategies, was deemed as baseline. • Risk-based objective function aimed to improve the system performance over the Base Case. • Cost objective function aimed to reduce the cost of the potential control structures. • Pareto archived dynamically dimensioned search (Asadzadeh & Tolson, 2011) enabled with “model preemption” strategy (Razavi et al., 2010) was used to solve the bi-objective optimization problem. • Three Regulation Plans were developed: • -4pt plan (four control points), controls on the outlets of Lakes Superior, MH, Erie, and Ontario Upper ST. Lawrence MICHIGAN Lake Huron NEW YORK Lake Michigan Lower ST. Lawrence ILLINOIS • KEY CONCLUSIONS • Four-point and Niagara three-point plans could reduce the frequency of extreme water levels across the eight extreme NBS scenarios at all evaluation points but lower St. Lawrence. • None of the multi-lake regulation plans could entirely eliminate the future extremes water levels. • Additional structures would be required to mitigate impacts of extreme levels at lower St. Lawrence River at Montreal. • Despite the excessive high cost, St. Clair 3pt plan cannot considerably improve the system performance. PENNSYLVANIA INDIANA Lake Ontario OHIO Hypothetical Structures (St. Clair and Niagara Rivers) Lake St. Clair Lake Erie - Niagara 3pt plan, controls on the outlets of Lakes Superior, Erie, and Ontario - St. Clair 3pt plan, controls on the outlets of Lakes Superior, MH, and Ontario RISK-BASED OBJECTIVE FUNCTION n: number of evaluation points (i.e., Lake Superior, Lake MH, …) m: number of NBS scenarios b= {bj,k| j = 1, 2, …, n & k = 1, 2, …, m} bj,k: base case performance on evaluation point j in scenario k y = {yj,k| j = 1, 2, …, n & k = 1, 2, …, m} yj,k: new regulation plan performance on evaluation point j in scenario k Risk of Failure at evaluation point j inscenario k: Riskj,k = yj,k/T where T is the total number of time steps in simulation. ACKNOWLEDGEMENT This poster partially presents a study funded by the International Upper Great Lakes Study (IUGLS), International Joint Commission. Full details of the original study is available in Tolson et al. (2011). FUTURE HYDROLOGIC CONDITION Eight different 70-year NBS scenarios were chosen from the 50,000-year stochastic NBS dataset produced for the Lake Ontario-St. Lawrence River Study (Fagherazzi et al., 2005). These scenarios represent a diverse range of possible future severe climate conditions. DSI2(i) DSI1(i) References Asadzadeh, M., and B. A. Tolson (2009), A new multi-objective algorithm, Pareto Archived DDS, In Proceedings of the 11th Annual Conference Companion on Genetic and Evolutionary Computation Conference: Late Breaking Papers (GECCO '09), 8-12 July 2009, Montreal, QC, Canada. ACM, New York, NY, USA. pp. 1963-1966. Fagherazzi L., Guay R., Sparks D., Salas J., Sveinsson O., (2005)- Stochastic modeling and simulation of the Great Lakes – St Lawrence River system – Report submitted to the International Lake Ontario-St. Lawrence Study. Levels Reference Study Board (1993). Levels Reference Study, Great Lakes-St. Lawrence River Basin, Final Report to the International Joint Commission, 144 pp. Razavi, S., B. A. Tolson, L. S. Matott, N. R. Thomson, A. MacLean, and F. R. Seglenieks (2010), Reducing the computational cost of automatic calibration through model preemption, Water Resour. Res., 46, W11523. Tolson B. A., S. Razavi, and M. Asadzadeh (2011), Formulation and evaluation of new control structures in the Great Lakes system, Technical Report produced for IUGLS International Joint Commission (IJC) Study. May, 9, 2011, 50 pages, (Project, principal investigator: Tolson). • COST OBJECTIVE FUNCTION • Excavation costs to increase the conveyance capacity of the St. Clair and Niagara Rivers were functions of the maximum required increase in the regulated flow over the natural channel flow at the same condition. • Control structures costs on St. Clair and Niagara Rivers were assumed $513.1 and $533.2 million, constant for all degrees of flow regulation (updated from the Levels Reference Study, 1993)
Developing Multi-Lake Regulation Plans for the Great Lakes through Multi-Scenario Optimization Saman Razavi, Bryan A. Tolson, and Masoud AsadzadehDept. of Civil & Environmental Engineering, University of Waterloo AGU Fall Meeting, Dec 6, 2011. Paper Number: ???? PROPOSED RULE CURVE FORM • PURPOSE AND SCOPE • Water levels across Great Lakes – St. Lawrence River system are critically important to the Canadian and US economies. • The two existing control structures on St. Marys and St. Lawrence Rivers may not prevent future excessively high and low levels across the system. • This study aims to evaluate the system performance when enabled with new control structures on St. Clair and Niagara Rivers under possible future climate scenarios at an exploratory level. Target Release(i , t) = Component 1(i , t) + Component 2(i , t) + Component 3(i , t) + Baseline Flow(i) i = 1, …, 4 for control points at the outlet of Lakes Superior, MH, Erie, and Ontario, respectively t: time on a quarter-monthly basis – for Lake Superior only on a monthly basis Component 1 where Z: water level at the beginning of a regulation period avgZ: historical average monthly levels RV : release volume planned for the current regulation period avgRV : the historical average monthly flow volume n and nd: normalizing constants Component 2 Component 3 USI(i) Three Regulation Plans and two Regulation Seasons were considered. 4pt Plan: the outlets of Lakes Superior, MH, Erie, and Ontario are controlled. 39 rule curve parameters for each season, a total of 78 parameters Niagara 3pt Plan: the outlets of Lakes Superior, Erie, and Ontario are controlled. St. Clair 3pt Plan: the outlets of Lakes Superior, MH, and Ontario are controlled. 29 rule curve parameters for each season, a total of 58 parameters Component 1 Component 3 Component 2 • DESIRED PERFORMANCE OF THE SYSTEM • Most of Great Lakes interests are able to cope with water levels within the range of historical extremes, but tend to suffer when levels exceed this range 1 Shortage Excess Shortage Excess Shortage Excess s3 Note: s3≥s1 s7=p.s5 Downstream Storage Indicator between points i+1 and i+2 Downstream Storage Indicator between points i and i+1 1 s5 Upstream Storage Indicator at point i 1 1 IF the lakes between control points i and i+1 and the lakes between control points i+1 and i+2 have not the same storage condition (both in shortage or both in excess) THEN Component 3 = 0 s7 s1 s8 1 1 s2 Note: s4≥s2 1 s8=p.s6 s6 • The desired water level range across the system is obtained by the system simulation over the historical 1900-2008 NBS data with the current control structures and regulation plans. • Water levels at seven evaluation points on Lakes Superior (Sup), Michigan-Huron (MH), St. Clair (SC), Erie (Er), and Ontario (On) as well as upper St. Lawrence River and lower St. Lawrence River are deemed representatives of all interests. • Evaluation of the direct impacts of the new control structures with multi-lake regulation plans on the different stakeholders is currently beyond the available data and tools. 1 s4 d2 d1 Single-scenario Optimization Results KEY CONCLUSIONS Four-point and Niagara three-point plans could reduce the frequency of extreme water levels across the eight extreme NBS scenarios at all evaluation points but lower St. Lawrence. None of the multi-lake regulation plans could entirely eliminate the future extremes water levels. Additional structures would be required to mitigate impacts of extreme levels at lower St. Lawrence River at Montreal. Despite the excessive high cost, St. Clair 3pt plan cannot considerably improve the system performance. The estimated cost o USI(1)= (ASup (ZSup – avgZSup)) / nSup USI(2) = ((RVSup – avgRVSup) + AMH (ZMH - avgZMH)) / nMH USI(3)= ((RVMH – avgRVMH) + ASC (ZSC – avgZSC) + AEr(ZEr– avgZEr)) / nEr USI(4)= ((RVEr – avgRVEr) + AON (ZON – avgZON)) / nON Upper St. Lawrence Lower St. Lawrence Iroquois H. W. Saunders H.W. DSI1(1)= (AMH (ZMH - avgZMH))/ ndMH DSI1(2)= (ASC (ZSC – avgZSC) + AEr(ZEr– avgZEr)) / ndEr DSI1(3)= (AON (ZON – avgZON)) / ndON DSI1(4)= (ZJetty1 – avgZJetty1) / ndJetty1 Pointe-Claire Lake Superior Jetty 1 4 5 2 2 1 7 6 3 DSI2(1)= (ASC (ZSC – avgZSC) + AEr(ZEr– avgZEr))/ndMH DSI2(2)= ((AON (ZON – avgZOn)) /ndEr DSI2(3)= (ZJetty1 – avgZJetty1)/ndON MICHIGAN QUEBEC Superior Weir (Existing Structure) WISCONSIN • METHOD • Base Case, system performance when regulated with current regulation strategies, was deemed as baseline of improvement. • Risk-based objective function aimed to improve the system performance over the Base Case. • Cost objective function aimed to reduce the cost of the potential control structures. • Pareto archived dynamically dimensioned search enabled with “model preemption” strategy was used to solve the bi-objective optimization problem. ONTARIO Driest Wettest Driest Wettest Driest Wettest Driest Wettest Driest Wettest Driest Wettest Driest Wettest MICHIGAN Moses Saunders Dam (Existing Structure) Lake Huron NEW YORK Lake Michigan Hypothetical Structures (St. Clair and Niagara Rivers) ILLINOIS PENNSYLVANIA Lake Ontario INDIANA OHIO Lake St. Clair FUTURE HYDROLOGIC CONDITION Eight different 70-year NBS scenarios were chosen from the 50,000-year stochastic NBS dataset produced for the Lake Ontario-St. Lawrence River Study (Fagherazzi et al., 2005). These scenarios represent a diverse range of possible future severe climate conditions. Lake Erie RISK-BASED OBJECTIVE FUNCTION n: number of evaluation points (i.e., Lake Superior, Lake MH, …) m: number of NBS scenarios b= {bj,k| j = 1, 2, …, n & k = 1, 2, …, m} bj,k: base case performance on evaluation point j in scenario k y = {yj,k| j = 1, 2, …, n & k = 1, 2, …, m} yj,k: new regulation plan performance on evaluation point j in scenario k Single-scenario formulation (k=1) zj= 0 if yj < bj(performance in point j better than baseline) zj= 1 if yj ≥ bj(performance in point j worse than baseline) Risk of Failure at evaluation point j : Riskj = yj/T where T is the total number of time steps in simulation. • Multi-scenario formulation • COST OBJECTIVE FUNCTION • Excavation costs to increase the conveyance capacity of the St. Clair and Niagara Rivers were functions of the maximum required increase in the regulated flow over the natural channel flow at the same condition. • Control structures costs on St. Clair and Niagara Rivers were assumed $513.1 and $533.2 million, constant for all degrees of flow regulation (updated from the Levels Reference Study, 1993) References Asadzadeh, M., and B. A. Tolson (2009), A new multi-objective algorithm, Pareto Archived DDS, In Proceedings of the 11th Annual Conference Companion on Genetic and Evolutionary Computation Conference: Late Breaking Papers (GECCO '09), 8-12 July 2009, Montreal, QC, Canada. ACM, New York, NY, USA. pp. 1963-1966. Fagherazzi L., Guay R., Sparks D., Salas J., Sveinsson O., (2005)- Stochastic modeling and simulation of the Great Lakes – St Lawrence River system – Report submitted to the International Lake Ontario-St. Lawrence Study. Levels Reference Study Board (1993). Levels Reference Study, Great Lakes-St. Lawrence River Basin, Final Report to the International Joint Commission, 144 pp. Tolson B. A., S. Razavi, and M. Asadzadeh (2011), Formulation and evaluation of new control structures in the Great Lakes system, Technical Report produced for IUGLS International Joint Commission (IJC) Study. May, 9, 2011, 50 pages, (Project, principal investigator: Tolson). DSI2(i) DSI1(i)