Download
1 / 17
190 likes | 540 Views
Histograms, Frequency Polygons, and Ogives. Section 2.3 . Represent data in frequency distributions graphically using histograms, frequency polygons, and ogives . . Objectives. To convey the data to the viewers in pictorial form

E N D
Histograms, Frequency Polygons, and Ogives Section 2.3
Represent data in frequency distributions graphically using histograms, frequency polygons, and ogives. Objectives
To convey the data to the viewers in pictorial form • It is easier for the most people, especially people without a background in statistics, to comprehend the meaning of data presented as a picture rather than data presented as a table. • To describe the data set graphically • To analyze the data set (Distribution of data set) • To summarize a data set • To discover a trend or pattern in a situation over a period of time • To capture viewers’ attention in a publication or during a presentation Purpose of Statistical Graphs
A bar graph that displays the data from a frequency distribution • Horizontal Scale (x-axis) is labeled using CLASS BOUNDARIES • Vertical Scale (y-axis) is labeled using frequency • NOTE: bars are contiguous (No gaps) What is a histogram?
STEP 1: Draw the x- and y-axes • STEP 2: Label the x-axis using the class boundaries • STEP 3: Label the y-axis using an appropriate scale that encompasses the high and low frequencies • STEP 4: Draw the contiguous vertical bars How do I create a histogram from a grouped frequency distribution?
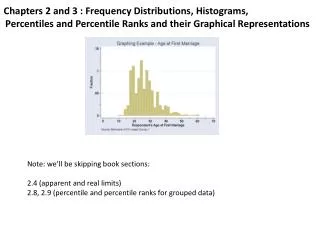
Example-Construct a histogram of the ages of Nextel Cup Drivers. Use the class boundaries as the scale on the x-axis
Line graph (rather than a bar graph) • Uses class midpoints rather than class boundaries on x-axis Frequency Polygon
Line graph (rather than a bar graph) • Uses class boundaries on x-axis • Uses cumulative frequencies (total as you go) rather than individual class frequencies • Used to visually represent how many values are below a specified upper class boundary Ogive (Cumulative Frequency Polygon)
We can use the percentage (relative frequency) rather than the “tallies” (frequency) on the x-axis. • Relative Frequency Histogram • Relative Frequency Polygon • Relative Frequency Ogive • Used when a comparison between two data sets is desired, especially if the data sets are two different sizes • Overall shape (distribution) of graph is the same, but we use a % on the y-axis scale Another possibility
Center: a representative or average value that indicates where the middle of the data set is located (Chapter 3) • Variation: a measure of the amount that the values vary among themselves • Distribution: the nature or shape of the distribution of data (such as bell-shaped, uniform, or skewed) • Outliers: Sample values that lie very far away from the majority of other sample values • Time: Changing characteristics of data over time Important Characteristics of Data
The nature or shape of the distribution can be determined by viewing the histogram or other graphs. • Knowing the shape of the distribution helps to determine the appropriate statistical methods to use when analyzing the data. • Distributions are most often not perfectly shaped, so focus on the overall pattern, not the exact shape Distribution
Bell-shaped (Normal) has a single peak and tapers at either end Uniform is basically flat or rectangular Common Distribution Shapes(p. 56)
J-shaped has few data on the left and increases as you move to the right Reverse J-shaped has a lot of data on the left and decreases as you move to the right
Right Skewed peaks on the left and tapers on the right Left Skewed peaks on the right and tapers on the left
Bimodal has two peaks of same height U-shaped peaks on left and right with dip in center
When you analyze histograms, look at the shape of the curve and ask yourself: • Does it have one peak or two peaks? • Is it relatively flat? • Is it relatively U-shaped? • Are the data values spread out on the graph? • Are the data values clustered around the center? • Are the data values clustered on the right or left ends? • Are there data values in the extreme ends? (outliers) Distribution Decision Making