1 / 1

Figure 2.6a. Acute hepatitis A reports*, by risk exposure † — United States, 2010

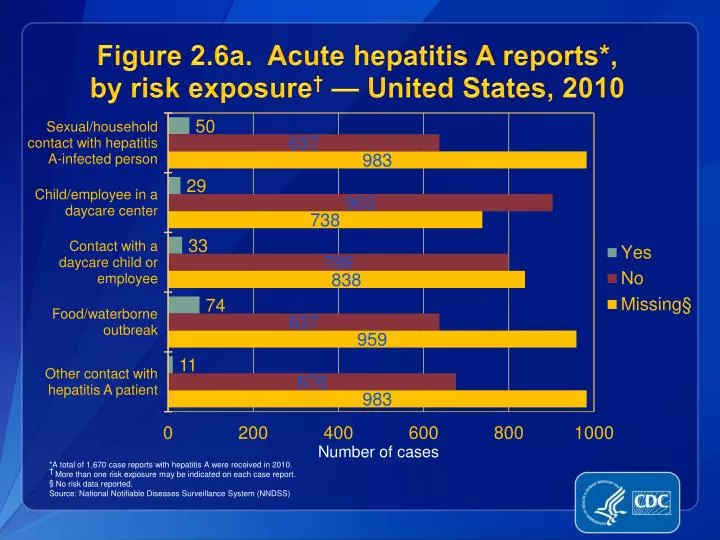
Figure 2.6a. Acute hepatitis A reports*, by risk exposure † — United States, 2010. Number of cases. *A total of 1,670 case reports with hepatitis A were received in 2010. † More than one risk exposure may be indicated on each case report. § No risk data reported.

dieter
Download Presentation

Figure 2.6a. Acute hepatitis A reports*, by risk exposure † — United States, 2010

An Image/Link below is provided (as is) to download presentation Download Policy: Content on the Website is provided to you AS IS for your information and personal use and may not be sold / licensed / shared on other websites without getting consent from its author. Content is provided to you AS IS for your information and personal use only. Download presentation by click this link. While downloading, if for some reason you are not able to download a presentation, the publisher may have deleted the file from their server. During download, if you can't get a presentation, the file might be deleted by the publisher.

E N D

Presentation Transcript


  1. Figure 2.6a. Acute hepatitis A reports*,by risk exposure† — United States, 2010 Number of cases *A total of 1,670 case reports with hepatitis A were received in 2010. †More than one risk exposure may be indicated on each case report. §No risk data reported. Source: National Notifiable Diseases Surveillance System (NNDSS)

More Related