Download
1 / 68
680 likes | 853 Views
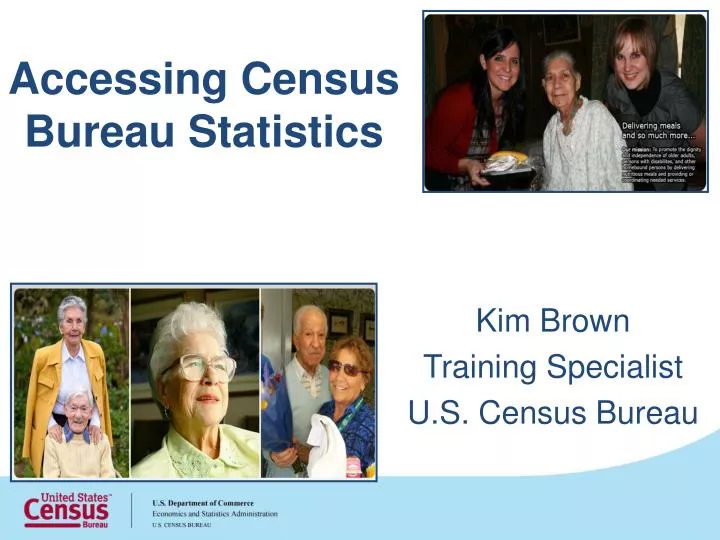
Accessing Census Bureau Statistics. Kim Brown Training Specialist U.S. Census Bureau. Objectives. Review Programs, Datasets and Topics Available Difference between Short and Long Form Sample vs. 100 percent Data Comparison of the Decennial and ACS Statistics

E N D
Accessing Census Bureau Statistics Kim Brown Training Specialist U.S. Census Bureau
Objectives • Review Programs, Datasets and Topics Available • Difference between Short and Long Form • Sample vs. 100 percent Data • Comparison of the Decennial and ACS Statistics • Difference between Estimates and Projections • Accessing Statistics using the American FactFinder
What is the ACS? • A large national survey that uses continuous measurement methods to produce detailed population and housing estimates each year • Designed to produce critical information that had previously come from the decennial census
ACS Topics Economic Social Demographic Housing
Older Population from the ACS http://www.census.gov/prod/2011pubs/acs-17.pdf
Disability http://2010.census.gov/news/releases/operations/cb11-cn192.html
Availability of ACS Statistical Products http://www.census.gov/acs/www/guidance_for_data_users/estimates/
StatisticalProducts Profiles Tables Detailed Tables Subject Tables Ranking Tables Geographic Comparison Tables • Data Profiles • Narrative Profiles • Comparison Profiles • Selected Population Profiles Narrative Profile
2010 Statistical Products and Publications • Tabulation and publications for • 50 states • District of Columbia • Puerto Rico • Summary Files • quick tables and demographic profiles • geographic comparison tables • ranking tables
Older Population Products http://2010.census.gov/2010census/data/ http://www.census.gov/prod/2010pubs/p25-1138.pdf
Population 65 years and Older http://www.census.gov/prod/cen2010/briefs/c2010br-09.pdf
Current Population Survey Supplements 2008-2012 Survey Years
Food Safety http://www.fns.usda.gov/fns/food_safety.htm
Senior’s Program http://www.fns.usda.gov/cga/FactSheets/SFMNP_Quick_Facts.htm
Estimates vs. Projections • Estimates – For the present and the past – Produced using administrative records and other statistics – The official measures of population and housing units between censuses – Monthly and Annual (July 1) for each year after the last published census • Projections – Estimates for future dates – Produced by making assumptions about future trends – Use the latest published census or estimates as a base
Estimates Statistics We Produce • Resident population • Totals • National, state, county, sub-county, and Puerto Rico Commonwealth and municipios • Demographic characteristics • National, state, and county • Age, sex, race, and Hispanic origin • Puerto Rico Commonwealth and municipios • Age and sex • Other data • Components of change • Births, deaths, and migration • Housing units • Population universes • Resident plus armed forces overseas, civilian, and civilian noninstitutionalized http://www.census.gov/popest/
Small Area Income Poverty Estimates (SAIPE) http://www.census.gov/did/www/saipe/data/interactive/
Small Area Health Insurance Estimates http://www.census.gov/did/www/sahie/data/interactive/index.html
Projections Statistics We Produce • Resident population • Demographic characteristics • National and state • Age, sex, race, and Hispanic origin • Other measures • Components of change • Births, deaths, and migration http://www.census.gov/population/www/projections/
Accessing StatisticsThrough the Tools • PopFinder - Compare populations for States, Counties, or Cities • QuickFacts – Locate statistics for all states, counties, cities and towns with more than 5,000 people • Interactive Map - Explore Census statistics through a mashup of population and economic data • American FactFinder– Find tables for many programs and datasets from national to ZCTA and Census Tracts • DataFerrett- Searches and retrieves data across federal, state, and local surveys, executes customized variable recoding, creates complex tabulations and business graphics • CPS Table Creator – Allows you to create customized tables from the Current Population Survey Annual Social and Economic Supplement
PopFinder http://www.census.gov/popfinder/
QuickFacts http://quickfacts.census.gov/qfd/index.html
Interactive Map http://www.census.gov/cbdmap/
2010 Interactive Map http://2010.census.gov/2010census/popmap
American FactFinder http://factfinder2.census.gov/
DataFerrett Powerful Tabulation Capabilities Simple table layout for frequencies and trends; supporting spreadsheet math for complex analysis • Massive Datasets • Complex Nesting • Formulas • Hide columns or rows • Use weighting variables http://dataferrett.census.gov/
CPS Table Creator http://www.census.gov/cps/data/cpstablecreator.html
Webinar Exercises Face to Face - classroom
Exercise #1 Using 2011 estimates what is the percent of persons 65 years and over in Charleston County, South Carolina? Is this percentage higher or lower than the state of South Carolina?
Exercise #2 Create a table for years 2008 to 2010, for persons living in New York who are 65 years and over, living in poverty, with a health disability, include their health insurance status. How many persons living in poverty have no insurance? How many living in poverty are insured?