Download
1 / 67
750 likes | 1.18k Views
MECHANISM OF FATIGUE & FRACTURE. 1) Fatigue overview 2) Stress controlled fatigue 3) Cumulative damage for v ariable a mplitude l oading 4) Strain controlled fatigue 5) Fracture mechanics. 1) FATIGUE OVERVIEW.

E N D
MECHANISM OF FATIGUE & FRACTURE
1) Fatigue overview 2) Stress controlled fatigue 3) Cumulative damage for variable amplitude loading 4) Strain controlled fatigue 5) Fracture mechanics
The concept of fatigue is very simple, when a motion is repeated, the object that is doing the work becomes weak. For example, when you run, your leg and other muscles of your body become weak, not always to the point where you can't move them anymore, but there is a noticable decrease in quality output. This same principle is seen in materials. Fatigue occurs when a material is subject to alternating stresses, over a long period of time. Examples of where fatigue may occur are: springs, turbine blades, airplane wings, bridges and bones.
Fatigue is one of the primary reasons for the failure of structural components. The life of a fatigue crack has two parts, initiation and propagation.
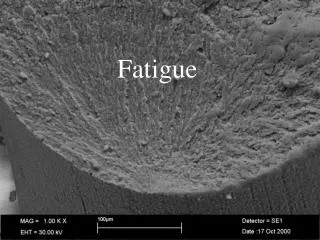
Crack initiation: Dislocations play a major role in the fatigue crack initiation phase. It has been observed in laboratory testing that after a large number of loading cycles dislocations pile up and form structures called persistent slip bands (PSB). PSBs are areas that rise above (extrusion) or fall below (intrusion) the surface of the component due to movement of material along slip planes. This leaves tiny steps in the surface that serve as stress risers where fatigue cracks can initiate.
A crack at the edge of a PSB is shown in the image taken with a scanning electron microscope (SEM).
The most common reasons for crack initiation in a component include: Notches, corners, or other geometric inconsistencies in the component Material inclusions, impurities, defects, or material loss due to wear or corrosion Mechanical or thermal fatigue
Once a crack has been initiated, repeated loadings can cause the crack to lengthen. Depending on the stress level and the number of load cycles applied, crack growth can be stable, with a predictable rate; unstable, with imminent failure; or occasionally a decrease or cessation of growth altogether.
Crack growth can be encouraged by factors other than applied load. Environmental effects, such as corrosion due to exposure to water or other solvents, as well as component wear can result in an overall loss of material in the component cross section, increasing the stress carried by the remaining material. This increased stress can accelerate crack growth and ultimate failure.
Also,crack initiation is tied to the microscopic material behavior. To a certain degree weld defects always exist both internally and on the weld surface. These weld defects may trigger the cracks to grow, which usually from the weld surface.
Crack propagation: Compared to the crack initiation, the crack propagation stage is better understood and different theories exist to model the crack growth, e.g. fracture mechanics. The major parameter governing crack propagation is the stress range to which the structural detail is subject to. Besides, the welding geometry and initial crack size have a large impact on the fatigue life of the structural detail. In welded structures, fatigue cracks almost always start at a weld defect and the propagation period accounts for more than 90% of the fatigue life.
The major share of the fatigue life of the component may be taken up in the propagation of crack. By applying fracture mechanics principles it is possible to predict the number of cycles spent in growing a crack to some specified length or to final failure. By knowing the material growth rate characteristics and with regular inspections, a cracked component may be kept in service for an extended useful life.
Fatigue Crack Growth Curves Typical constant amplitude crack propagation data are shown in Fig. 2. The crack length, a, is plotted versus the corresponding number of cycles, N, at which the crack was measured.
As shown, most of the life of the component is spent while the crack length is relatively small. In addition, the crack growth rate increases with increased applied stress. The final crack size, af, must be evaluated. This may be done using as follows:
Fracture Failure: • Fracture failure of the structural details will occur eventually when the crack size propagates to a critical size. The final fracture depends upon a couple of parameters like; • Stress level • Crack size • Material toughness • Similar to crack initiation, the fatigue life during the final fracture is a small part and is usually negligible compared to the crack propagation stage.
High-cycle fatigue; In high-cycle fatigue situations, materials performance is commonly characterised by an S-N curve, also known as a Wöhler curve . This is a graph of the magnitude of a cyclical stress (S) against the logarithmic scale of cycles to failure (N).
Low-cycle fatigue; Where the stress is high enough for plastic deformation to occur, the account in terms of stress is less useful and the strain in the material offers a simpler description. Low-cycle fatigue is usually characterised by the Coffin-Manson relation (published independently by L.F.Coffin in 1954 and S.S. Manson 1953); Typically, a fatigue is called “low-cycle fatigue” if the number of cycles to failure is less than 104. The number of cycles in a high-cycle fatigue is usually several millions. For marine structures, the latter has been of real concern.
Methods for Fatigue Analysis; One of the most generally used methods is S-N Approach , which is the most suitable one for design purpose, and the other one is Fracture Mechanics Approach. S-N Curve Approach; There are three methodologies for fatigue damage calculations, depending on the mothods of determining fatigue loads; Simplified Fatigue Analysis; Simplified Fatigue Assessment - assuming that the stress range follows a Weibull distribution .
When the shape parameter, ξequals to 1, the Weibull distribution yield to the Exponential distribution. • The value of ξ can be larger or smaller than 1. The higher the ξ values, the more severe cyclic loading conditions are. • Typical values for the Weibull shape parameter ξ are given in Table for some commercial ships and offshore structures.
The spectral fatigue analysis and extensive fatigue damage data may be used to calibrate the Weibull parameters for various types of ship and offshore structures. • Luyties and Stoebner (1998) presented a procedure to calibrate the M I simplified fatigue design method using spectral fatigue analysis. • Spectral Fatigue Analysis; • The simplified fatigue assessment has been successfully applied to the ship fatigue design in which allowable stresses are precalculated for different locations in a ship. • Due to the excessive sensitivity of the estimated fatigue damage to the Weibull parameters, a spectral fatigue assessment becomes more popular for offshore structural analysis. • The spectral fatigue analysis may also be applied to ship structures provided that the wave scatter diagram is adequately defined because the ships are designed for un-restricted services.
Time Domain Fatigue Analysis; • Similarity between Time-Domain Fatigue Analysis and Spectral Fatigue Analysis both procedures are based on wave-scatter diagram. • The difference between Time-Domain Fatigue Analysis and Spectral Fatigue Analysis: • Time Dominant Fatigue Analysis is a deterministic analysis, and includes the effect of non-linearity, on the other hand Spectral Fatigue Analysis is a stochastic approach based on linear analysis. • Time-domain fatigue assessment is mainly applied to the following scenarios; • Fatigue of TLP tethers (Fylling and Larsen, 1989) • Fatigue of pipelines and risers due to wave-induced forces (Bai, 2001) • Fatigue of Spar structures due to low frequency motions (Luo, 2001)
Fracture Mechanics Approach; • Fracture mechanics method is used to determine acceptable flaw size, assessing the fatigue crack growth, planning inspection and repair strategy. • Applications of the fracture mechanics in marine structural design include: • Assessment of final fracture • Determination of crack propagation to plan in-service inspection and determine remaining life of anexisting structure • Fatigue assessment in case S-N based fatigue assessment is inappropriate • Calibration of fatigue design S-N Curves,
Stress-controlled fatigue is generally related to high cycle (low stress) fatigue, in which amajor part of the material behaves elastically. Even though the material immediately adjacentto the notch may become plastic, both the extent of plastic zone, and the stress in it are limited. Since stress is directly proportional to strains, conventionally, the fatigue strength is expressed in terms of stress.
One of the earliest investigations of stress-controlled cyclic loading effects on fatigue life was performed by a german engineer named August Wohler in 1893 who studied railroad wheel axle failure. His work on fatigue marks the first systematic investigation of S-N Curves, also known as Wöhler curves, to characterise the fatigue behaviour of materials. Several important facts were revealed from his investigation
First, the number of cycles to failure increases with decreasing stress range. Below a certain stress range, which is referred to as fatigue endurance limit, the fatigue life is infinite. Second, the fatigue life is reduced dramatically by the presence of a notch. These observations indicate that fatigue is a three-stage process involving initiation, propagation, and a final failure stage
N : Periyodik yükleme sonucunda kırılmanın oluştuğu tekrar sayısı
The scatter in the S-N curves is due to these factors : Wall thickness Corrosion Type and condition of the material including a number of metallurgical variables. Test environment,specimen surface,alignment of the test machine etc Residual stress, mean stress or stress ratio Local stress peaks (notch effects)
Dayanımı 900 N/mm olan çeliğin, çeşitli yüzey durumuna göre yorulma dayanımları: Ayna gibi parlamış yüzeyde ise çekme dayanımının % 50 si yorulma dayanımıdır: 450 N/mm Taşlanmış yüzeyde bu değer % 12 daha azdır. 450x0.88=396 N/mm Haddelenmiş ise bu değer % 53 daha azdır. 450x0.47=212 N/mm Korozif bir ortamda çalışılıyorsa % 73 daha azdır. 450x0.27= 122 N/mm
Most of the theories assume that the amplitudes and frequencies are constant. However in real situations the truth is not like this. For the realistic scenarios, we use cumulative damage theories.
Cumulative damage theories can be concentrated in two main topics: Linear cumulative damage Non-linear cumulative damage
LINEAR CUMULATIVE DAMAGE (Palmgren – Miner Theory) Acording to this theory, damage ratio in a certain strain level (σ) is related to ratio of actual period number to period number of damage.
Experiments show that K is between 0,7 and 2,2. Most recommonded value of K is 1
n1 = c1 x Neş , n2 = c2 x Neş , n3 = c3 x Neş ,….. So ; Ci : Proportion Factor
Palmgren- Miner theory is a common used theory because of its simplicity. However, this theory neglects several important situations like; importance of orders of applied strains, etc. But for an estimation of damage and failure, PMT is satisfactory.
NON – LINEAR THEORIES Marco – Starkey Cumulative Damage Theory Henry Cumulative Damage Theory Gatts Cumulative Damage Theory Cortan – Dolan Cumulative Damage Theory Marin Cumulative Damage Theory Manson Linear Damage Theory
Related to low cycle- high stress fatigue • Stress of low cycle fatigue is high enough to cause plastic deformation in region of stress concentration so Stress- strain relation will not be linear The relation is given by hysteresis loop • It changes from cycle to cycle
Under constant strain range conditions there is a relation between fatigue life(N) and a strain parameter Manson states that m:variable depending on material and environmental conditions, ~ 0.5