Download
1 / 15
150 likes | 267 Views
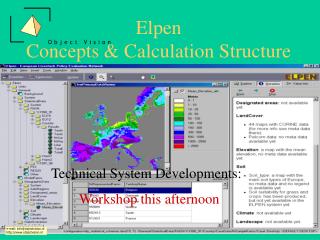
allocation of ELPEN farm systems. Berien Elbersen Maarten Hilferink Wim Nieuwenhuizen Marta Pérez-Soba Janneke Roos Alterra, The Netherlands Udine, 22 nov 2002. To determine environmental and socio-economic impacts we need:. real farm data grouped in farm systems

E N D
allocation of ELPEN farm systems Berien Elbersen Maarten HilferinkWim Nieuwenhuizen Marta Pérez-Soba Janneke Roos Alterra, The Netherlands Udine, 22 nov 2002
To determine environmental and socio-economic impacts we need: real farm data grouped in farm systems (survey information from representative farms to understand and model the farming practices and their behaviour) to locate the farm systems (to connect them to the environment they influence, e.g. social and (a)biotic circumstances, landscape, biodiversity) to determine how farm practices have impact on the environment (employment, eutrophication, acidification, habitat maintenance etc.)
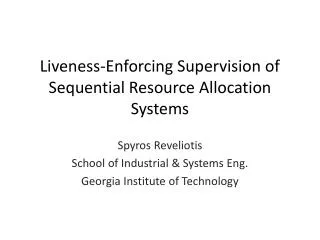
Allocation exercises at a national level • Objective: validation and improving the methods for allocation of animal categories • Using: collecting statistical data on a lower regional level than NUTS 2, e.g. canton in France, grids of 5 km² in Denmark • Countries: Denmark, France, The Netherlands, Portugal, Spain, UK (England & Wales and Scotland)
Method: 1) Regression analyses to estimate the influence (weight) of different variables on the number of animals 2) Use the regression formula to improve the allocation approach 5 in ELPEN 3) Compare these results with national data on the number of livestock on a lower territorial level 4) Compare the results of the old approach 5 with the national data and find out whether the new approach has better results.
Multivariate Regression Analyses Selection of relevant variables Regression formula Configuration in ELPEN system Estimation of animal numbers at grid level National data on grid level Conclusions on accuracy Conclusions on allocation in ELPEN Spatial variables Animal categories (nr per sub-region) CORINE Land cover classesClimateAltitudeSoil typeAccessibility (Denmark) Dairy cowsSuckler cowsSheep dairySheep meatGoats
Results France Dairy Cows France 1 Pastures2 Complex cultivation patterns3 Discontinuous urban fabric4 Broad-leafed forest Dairy Sheep France 1 Natural grassland2 Complex cultivation patterns3 Transitional woodland/shrub4 Non-irrigated arable land5 Pastures Meat Sheep France 1 Pastures2 Land principally occupied by agric.3 Broad-leafed forest4 Sclerophyllous vegetation Cantons in France
Results Denmark Dairy Denmark: 1 Non-irrigated arable land2 Complex cultivation patterns3 Pastures4 Land principally occupied by agric. Sheep Denmark 1 Pastures2 Land principally occupied by agric.3 Complex cultivation patterns4 Non-irrigated arable land Conclusions of comparison: Approach 5: 50% of grid cells correct Using results regr analysis: 55 to 60% 5km grid data
Conclusion for the allocation in ELPEN: The allocation should be improved The allocation rules must be: spatially and farm-/livestocktype specific Use of national data is not practical So: Use all the specific spatial and farm/livestock data we have in the ELPEN system for the allocation
How to allocate (groups of) ELPEN farm systems on grid cell level? The available statistical data on the ELPEN farm systems are: FADN data on land use and livestock on HARM1 or ELPEN region level But also: LFA & altitude level + relation with EU farm type So: Use FSS data on corresponding EU farm types to desaggregate to HARM2 level Use Corine/Pelcom land cover data in correspondence with the land use data to desaggregate to grid cell level Use LFA & Altitude geodata on grid cell level to allocate the in FADN provided # of LU, UAA within these regions
HARM region 7a: • 3 farm system types • 107879 Livestock units • 78056 ha of UAA • HARM region 7b: • 4 farm system types • 77065 Livestock units • 56098 ha of UAA • HARM region 7d: • 2 farm system types • 45673 Livestock units • 42310 ha of UAA • HARM region 7c: • 2 farm system types • 56054 Livestock units • 45308ha of UAA Why do we need ELPEN regions? • ELPEN region 7: • 17 farm system types • 512896 Livestock units • 456098 ha of UAA • Total of HARM regions: • 11 farm systems (6 are missing) • 56% of LU in ELPEN region • 49% of UAA in ELPEN region
LU, UAA / HARM1 regionLU, UAA / ELPEN region FADN ELPEN farm system UAA / HARM2 regions FSS Corr. EU farm types Landuse groups/ELPEN farmsystem UAA / HARM1 regionUAA / ELPEN region FADN CorinePelcom corr.landcover groups Ha / Grid cell LFA, Altitude/ELPEN farmsystem FADN LU, UAA / LFA,Alt in HARM1 LFA &Altitude LFA, Altitude regions Ha / Grid cell Allocated ELPEN farm system LU, UAA / Grid cell Data Allocation items Aggregation level
70% UAA ofEU farmtype A 30% UAA ofEU farmtype B 20% UAAin Harm2-a x 0.7=14% 30% UAA in Harm2-b x 0.7=21% 50% UAA in Harm2-c x 0.7=35% 60% UAA inHarm2-a x 0.3=18% 30% UAA inHarm2-b x 0.3=9% 10% UAA inHarm2-c x 0.3=3% 14% + 18% = 32% 21% + 9% = 30% 35% + 3% = 38% 32% x LU Efsin HARM2-a 30% x LU Efsin HARM2-b 38% x LU Efsin HARM2-c Allocation of ELPEN farm system (group)s (EFS)1) Desaggregate to HARM2 level using FSS data Efs D in HARM1-y
600 ha perm grass 200 ha rough grazing 50 LU >150 doff farm grazing 1000 hafodder 5000 ha other crops grid cell: 0.5 x ha pastures grid cell: 1 x haextensive grazing areas Grid cell: 0.5 x hacompl cult pattern Gridcell: 0.1 x ha agr. area 1200 ha pasture 200 ha extensive grazing areas 2000 hacompl cult pattern 50000 ha agr. area Allocation of ELPEN farm system (group)s (EFS)2) Desaggregate to GRID level using Corine/Pelcom Efs D in HARM1-y Corine/Pelcom land cover groupsin HARM1-y
200 LU LFA > 300m 300 LUnon LFA < 300m Allocation ELPEN farms system (group) D in HARM1-y on grid level grid cell: 1 x haextensive grazing areas 0.5 x ha pastures Grid cell: 0.5 x hacompl cult pattern Gridcell: 0.1 x ha agr. area 32% x LU Efsin HARM2-a 30% x LU Efsin HARM2-b 38 x LU Efsin HARM2-c Allocation of ELPEN farm system (group)s (EFS)3) use LFA & Altitude geodata to complete the allocation Efs D in HARM1-y