Download
1 / 1
10 likes | 123 Views
Changes in Soil and Bermudagrass Plant Tissue K With Rate of Application and Time. Savoy ,*H.J. 1 , Leib, B. 1 , and Joines, D. 2 1 Associate Professors, University of Tennessee, Biosystems Engineering and Soil Science, Extension

E N D
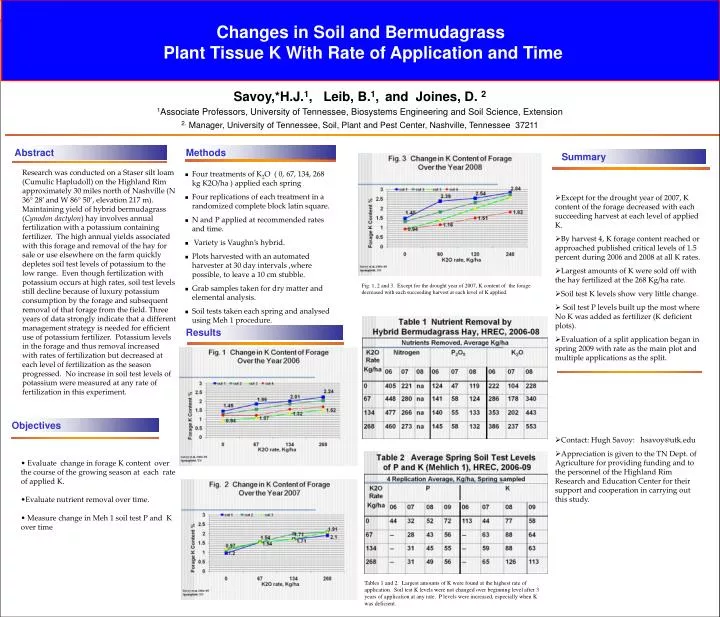
Changes in Soil and Bermudagrass Plant Tissue K With Rate of Application and Time Savoy,*H.J.1, Leib, B.1, and Joines, D. 2 1Associate Professors, University of Tennessee, Biosystems Engineering and Soil Science, Extension 2.Manager, University of Tennessee, Soil, Plant and Pest Center, Nashville, Tennessee 37211 Abstract Methods Summary Research was conducted on a Staser silt loam (CumulicHapludoll) on the Highland Rim approximately 30 miles north of Nashville (N 36° 28’ and W 86° 50’, elevation 217 m). Maintaining yield of hybrid bermudagrass (Cynodondactylon) hay involves annual fertilization with a potassium containing fertilizer. The high annual yields associated with this forage and removal of the hay for sale or use elsewhere on the farm quickly depletes soil test levels of potassium to the low range. Even though fertilization with potassium occurs at high rates, soil test levels still decline because of luxury potassium consumption by the forage and subsequent removal of that forage from the field. Three years of data strongly indicate that a different management strategy is needed for efficient use of potassium fertilizer. Potassium levels in the forage and thus removal increased with rates of fertilization but decreased at each level of fertilization as the season progressed. No increase in soil test levels of potassium were measured at any rate of fertilization in this experiment. • Four treatments of K2O ( 0, 67, 134, 268 kg K2O/ha ) applied each spring . • Four replications of each treatment in a randomized complete block latin square. • N and P applied at recommended rates and time. • Variety is Vaughn’s hybrid. • Plots harvested with an automated harvester at 30 day intervals ,where possible, to leave a 10 cm stubble. • Grab samples taken for dry matter and elemental analysis. • Soil tests taken each spring and analysed using Meh 1 procedure. • Except for the drought year of 2007, K content of the forage decreased with each succeeding harvest at each level of applied K. • By harvest 4, K forage content reached or approached published critical levels of 1.5 percent during 2006 and 2008 at all K rates. • Largest amounts of K were sold off with the hay fertilized at the 268 Kg/ha rate. • Soil test K levels show very little change. • Soil test P levels built up the most where No K was added as fertilizer (K deficient plots). • Evaluation of a split application began in spring 2009 with rate as the main plot and multiple applications as the split. • Contact: Hugh Savoy: hsavoy@utk.edu • Appreciation is given to the TN Dept. of Agriculture for providing funding and to the personnel of the Highland Rim Research and Education Center for their support and cooperation in carrying out this study. Fig. 1, 2 and 3. Except for the drought year of 2007, K content of the forage decreased with each succeeding harvest at each level of K applied. Results Objectives • Evaluate change in forage K content over the course of the growing season at each rate of applied K. • Evaluate nutrient removal over time. • Measure change in Meh 1 soil test P and K over time Tables 1 and 2. Largest amounts of K were found at the highest rate of application. Soil test K levels were not changed over beginning level after 3 years of application at any rate. P levels were increased, especially when K was deficient.