Download
1 / 40
400 likes | 579 Views
Complex Formation. CE 541. Complex ions consist of one or more central ions (usually metals) associate with one or more ions or molecules (ligands). Ligands act to stabilize the central ion (metal) and keep it in solution. Mononuclear Complexes.

E N D
Complex Formation CE 541
Complex ions consist of one or more central ions (usually metals) associate with one or more ions or molecules (ligands). Ligands act to stabilize the central ion (metal) and keep it in solution.
Mononuclear Complexes Consist of one single central ion to which is bound a number of neutral or anionic ligands The number of ligands attached to the central ion is called coordination number If we take Cu2+ as a central ion and NH3 as ligand
Table 4 shows more formation constants for various ligands and complexes. When formation constants are available, the concentration of the complex ion can be performed. The significance of complexes can be illustrated graphically using Logarithmic Concentration Diagrams.
pNH3 (-log NH3) if concentration of Cu2+ is fixed, equations (1) to (4) become straight lines on the Logarithmic Concentration Diagram. Equation (1) becomes from Table 4 log K1 = 3.99
Mixed Ligand Complexes Natural waters contain several ligands (Cl-, NH3, S2-, OH-) competing for complex formation with metal ions How to solve the problem: • All stepwise equilibrium for each ligand and the metal must be considered • Assume the unassociated (uncomplexed) ion concentration • Determine concentration of each complex for each ligand
Problem 4.66 Draw a logarithmic concentration diagram illustrating the effect of chloride concentration on the relative concentrations of various chloride complexes of mercury, assuming [Hg2+] = 10-7 mol/l. Which complex predominates when the chloride concentration equals 0.1 mg/l, 1 mg/l, 10 mg/l, and 100 mg/l.
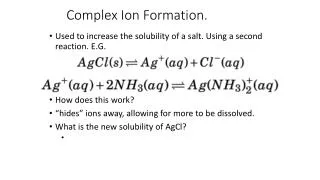
Solubility of Salts “All salts are soluble to some degree” AgCl Ag+ + Cl- AgCl is known to be insoluble. With insoluble salts the saturation value is reached very quickly. The equilibrium that exists between the solids state of a compound and its ion can be represented by the following equilibrium:
Since AgCl is in solid state, it can be considered as constant (say Ks) Ksp = solubility product constant
Logarithmic Concentration Diagrams for Simple Solubility Determination The diagram was draw based on: • Solubility product constants (Table 2.5) • The following solubility product relationships: • [M2+][CO32-]=Ksp • log[M2+] = pCO3 + log Ksp
The result is straight line with slope = 1 [CO32-] is represented by a line with slope = -1 and as a function of pCO3 Pb2+ is the least soluble and Mg2+ is the most soluble Intersection of CO32- line with cation line (say Pb) indicates the solubility condition for that cation (Pb) [M2+] = [CO32-] = solubility Example Determine the solubility of Ca2+ in water containing 10-3 M carbonate @ 25 C. Solution pCO3 = -log 10-3 = 3 from the figure at pCO3 = 3, log[Ca2+] = -5.3 so, solubility = S = 10-5.3 = 5 10-6 M
Complex Solubility Relationships “Solubility relationships are generally complex” • ionic strength affects the ion activity (using molar concentration will not give exact solution) • Cations and anions may form complexes with other materials in solution (reduce the effective concentration of cations and anions) • Other ions may form salts with less solubility than the one under consideration • Other equilibria beside solubility product affect the concentration of the ions present
The relationship can be drawn as shown in the figure. Slope of the line = -Z
(2) Effect of Weak Acids and Bases pH • Affects solubility of metal hydroxides, and • Affects other equilibria which affect solubility (such as that of weak acids) Take CaCO3 as an example
If NaOH was added to adjust the pH and if CaCl2 was added to the solution • At what [Ca2+] will the solution be saturated with respect to CaCO3 • How the saturation value will be affected by pH and CT How can we solve the problem? Use equations (1) to (4) in addition to: Equations (1) to (6) can be solved by trial and error. The relationship between CT, pH, and saturation value of [Ca2+] can be represented graphically.
(3) Effect of Complexes “Complex formation affects the solubility of salts” Take Zn as an example Base is added to increase pH to form insoluble Zn(OH)2 If excess base was added, Zn forms complexes with OH- (soluble) This behavior can be expressed by the following: (a) Solubility product
(b) Complex formation (c) Water ionization
How to construct the diagram (solubility of Zn(OH)2 as a function of pH) • For a given pH, find OH- from equation (6) • Use it in Equation (1) to find Zn2+ • Use Zn2+ in equation (2) to find [ZnOH+] • Continue the approach to find all complexes • Use equation (7) to find CT
logC-pH equations for each Zn species can be developed take log of equation (1)
Similarly, taking the log of equation (2) following the same approach, similar equations for the remaining Zn-hydroxide complexes can be developed
The solubility of metals can be complicated by the presence of ligands other than hydroxides (ammonia as an example) Now, how ammonia will affect the solubility of Zn(OH)2. There are four (4) Zn–NH3 complexes as shown in Table 4-4.
Assuming that the concentration of Zn-NH3 complexes is small compared to [NH4+] and [NH3], then Use these equations together with those of Zn-OH to construct the diagram of Zn(OH)2 solubility in the presence of ammonia (NH3)
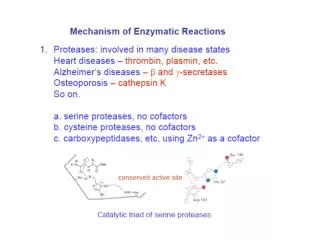
Oxidation – Reduction Reactions “Oxidation - reduction reactions tend towards a state of equilibrium” • Oxidation-reduction reactions are complex • Understanding the equilibrium of such reactions will help to indicate whether certain reactions can occur under certain conditions Example Use half reactions for the reduction of NO3- to NH4 (Table 2-4)
The Redox potential can be indicated by pE • If pE is large, then system oxidizing. So, half reactions are driven to the left • If pE is small, then system is reducing. So, half reactions are driven to the right
Logarithmic Concentration Diagram It can be used to illustrate the equilibrium concentrations for NH4+ and NO3- and a function of pE or E. The diagram was constructed @ 25 C using: pE value can be found in Table 2-4
At pH = 7 [H+] = 10-7 Thus
pE-pH Diagrams As shown pE is a function of [H+] which means it is a function of pH The general form of equation to be used in constructing the pE-pH diagrams is: (reduced) represents species on the reduced side (oxidized) represents species on the oxidized side
Then [H+] was separated from the log term In order to draw pE-pH diagram for nitrogen system, the following relationships will be needed: