Download
1 / 21
210 likes | 280 Views
Luminosity and Mass functions in spectroscopically-selected groups at z~0.5. George Hau, Durham University Dave Wilman (MPE) Mike Balogh (Waterloo) Richard Bower (Durham) John Mulchaey, Gus Oemler (Carnegie) Ray Carlberg (Toronto). Plan of talk. Motivation

E N D
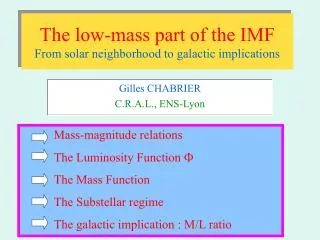
Luminosity and Mass functions in spectroscopically-selected groups at z~0.5 George Hau, Durham University Dave Wilman (MPE) Mike Balogh (Waterloo) Richard Bower (Durham) John Mulchaey, Gus Oemler (Carnegie) Ray Carlberg (Toronto)
Plan of talk • Motivation • CNOC2 Groups at 0.3 < z < 0.55 survey • Preliminary LFs for individual groups • Mass function • Summary
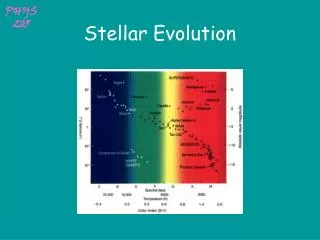
Motivation Kodama & Bower 2004 • Kodama & Bower 2004: Little evolution in stellar mass of cluster galaxies since z~1 • Decline of volume-averaged SFR by fact of ~5 from z~1-2 to present. • Poorer environments such as groups must drive the evolution of field galaxy population since z~1. Little evolution in clusters since z~1
Motivation • > 50% of present day galaxies in groups. Groups = typical environment of galaxies. • Understanding "cosmic downsizing”: Active star formation shifts to lower and lower mass galaxies as the Universe evolves. But… • Groups have low density contrast against background-- hard to build large samples (Eke review. See also works by Mulchaey, Zabludoff, Ponman etc) • Compact Groups (eg. Hickson et al 1989) • X-ray luminous (e.g. Mulchaey et al 2003) • Radio selected (e.g. Allington-Smith et al 1993) Our approach: Select groups based on redshifts and positions
CNOC2 Groups at 0.3≤z≤0.55: • Based on CNOC2 redshift survey (Yee et al 2000): 4x10⁴ galaxies with UBVRI photometry + 6000 redshifts • Groups detection by • Friends-of-friends algorithm • Spatial (1.5*r200) + velocity (3σ) trimming + iteration. • 200 Groups 0.12 < z < 0.55 identified (Carlberg et al 2001).
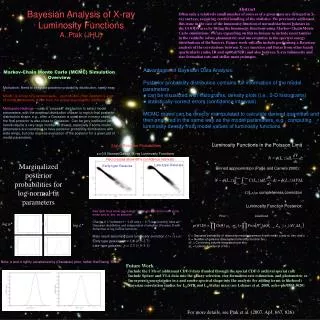
[OII] [OII] Magellan followup spectroscopy (Wilman et al 2004) • Extended spectroscopic sample to RC=22.0 • Final sample contains (0.3 < z < 0.55): • 282 members in 26 groups. • 334 serendipitous field galaxies. • Selection function is well understood and sample is representative. • [OII] emission infers presence of star formation (EW≥5Ǻ). • SED fitting -> rest-frame luminosities. • Groups range in σv from < 100 km/s to ~800 km/s (~poor cluster) [OII] [OII]
Galaxy properties and evolution in groups -- see Dave Wilman’s talk Wilman et al 2004 Wilman et al 2004 groups
Additional data • GALEX UV imaging (current) • star formation • NIR imaging: SOFI, Spitzer GTO • Chandra observations scheduled
HST Morphologies • Observations of 20 groups for 1 orbit each in F775W filter. • Visual classification by Gus Oemler of all 0.3 ≤ z ≤ 0.55 galaxies in the 16 fields • Classification possible to R~23.9, according to the MORPHS scheme. • Preliminary results for 16 ACS fields. • 158 classified group galaxies & 124 classified field galaxies.
New FORS2 spectroscopy: probing z~0.5 counterparts of local post-starburst population Kauffmann et al 2003 stellar age indicator for SDSS galaxies
New VLT FORS spectroscopy • FORS2 Followup spectroscopy: • Targeting faint galaxies down to R~23 to improve completeness & probe star forming population • June 2005: 3 nights, 6 groups -- preliminary results presented here • ~240 new redshifts, >27 new group members • Sep 2005: 10.4 hrs, 4 groups. Data not reduced yet
Galaxy selection function Old LDSS2 data + new FORS2 data After correction Fraction of galaxies with z R Survey limit
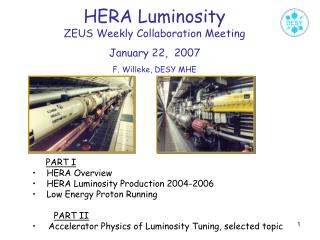
New data Old data Luminosity function of individual groups (preliminary) z=0.359 z=0.372 z=0.510 M* z=0.471 z=0.536 z=0.361
Morphological segregation Group 37 dec RA r’0 dv (km/s)
Morphological segregation Group 38 dec RA r’0 dv (km/s)
Mass function of CNOC2 groups (Balogh et al in prep) • Spitzer GTO data in sub area of survey • Chose groups with >60% IR spatial coverage • Matched IR data (IRAC 3.6µm) to CNOC2 groups catalogue. • Mass from stellar M/L ratios calculated using population synthesis models • Total stellar mass Mstellar for all gals within R200.
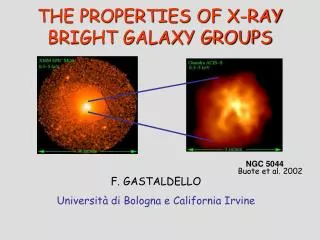
Combined Mass Function Local MF, α=-0.6 Combined MF, z~0.3 More IR data will help--Valentine take note! :)
Summary • New FORS2 spectroscopy down to R~23.2 • Presented LF functions for 6 groups • Presented mass functions using SPITZER imaging • No evidence for trends in Mass Functions -- in concordance with idea that group stellar mass in place by z~1. (cf. Conselice’s talk) • Future Plan: • Combined LF & MS & comparison with local functions • Investigation of SFH with [OII] • Serendipitous groups & filaments. • Improving mass function using SOFI data
See Dave Wilman’s talk • Galaxy properties and evolution in groups