Download
1 / 1
10 likes | 174 Views
Variables/Loadings Plot for Multiple SPC files. Variables/Loadings Plot for Multiple SPC files. 0.025. 0.06. 8. 0.05. 0.02. 0.04. 0.03. 0.015. 7. Loadings on PC 1 (99.97%). Loadings on PC 2 (0.03%). 0.02. 0.01. 0.01. 0. 6. -0.01. 0.005. -0.02. 0. -0.03. 400. 600. 800.

E N D
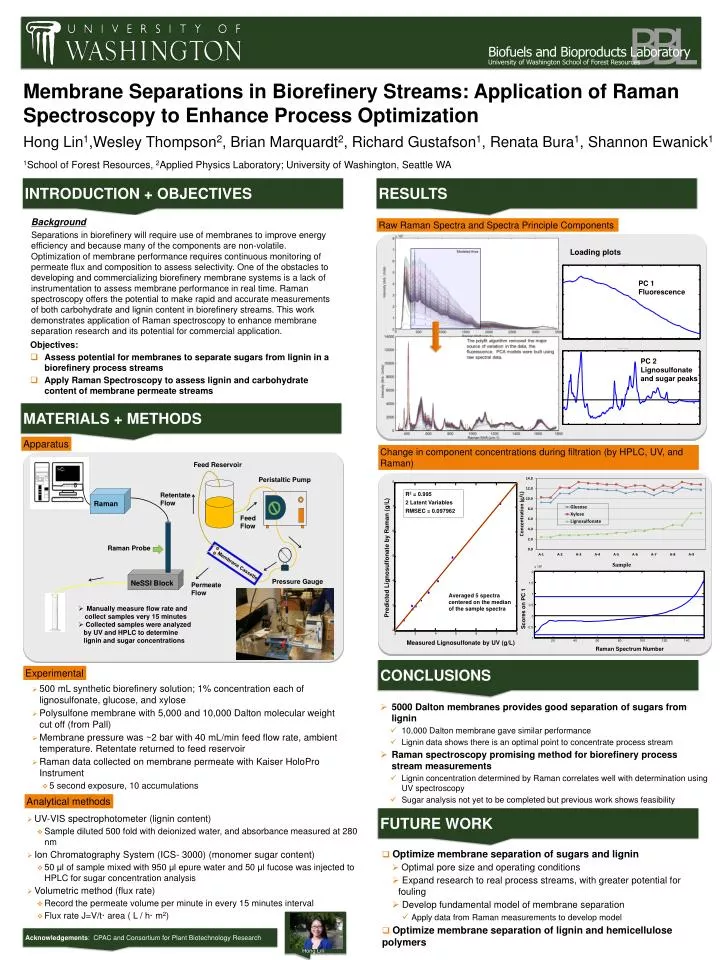
Variables/Loadings Plot for Multiple SPC files Variables/Loadings Plot for Multiple SPC files 0.025 0.06 8 0.05 0.02 0.04 0.03 0.015 7 Loadings on PC 1 (99.97%) Loadings on PC 2 (0.03%) 0.02 0.01 0.01 0 6 -0.01 0.005 -0.02 0 -0.03 400 600 800 1000 1200 1400 1600 1800 400 600 800 1000 1200 1400 1600 1800 Variable Variable Predicted Lignosulfonate by Raman (g/L) 5 4 3 2 2 3 4 5 6 7 8 Measured Lignosulfonate by UV (g/L) x 106 2 1.5 1 Membrane Separations in Biorefinery Streams: Application of Raman Spectroscopy to Enhance Process Optimization Scores on PC 1 0.5 Membrane Cassette 0 -0.5 Hong Lin1,Wesley Thompson2, Brian Marquardt2, Richard Gustafson1, Renata Bura1, Shannon Ewanick1 -1 20 40 60 80 100 120 140 Raman Spectrum Number 1School of Forest Resources, 2Applied Physics Laboratory; University of Washington, Seattle WA INTRODUCTION + OBJECTIVES RESULTS Loading plots Background Separations in biorefinery will require use of membranes to improve energy efficiency and because many of the components are non-volatile. Optimization of membrane performance requires continuous monitoring of permeate flux and composition to assess selectivity. One of the obstacles to developing and commercializing biorefinery membrane systems is a lack of instrumentation to assess membrane performance in real time. Raman spectroscopy offers the potential to make rapid and accuratemeasurements of both carbohydrate and lignin content in biorefinery streams. This work demonstrates application of Raman spectroscopy to enhance membrane separation research and its potential for commercial application. Raw Raman Spectra and Spectra Principle Components PC 1 Fluorescence PC 2 Lignosulfonate and sugar peaks • Objectives: • Assess potential for membranes to separate sugars from lignin in a biorefinery process streams • Apply Raman Spectroscopy to assess lignin and carbohydrate content of membrane permeate streams Feed Reservoir MATERIALS + METHODS R2 = 0.995 2 Latent Variables RMSEC = 0.097962 Peristaltic Pump Retentate Flow Raman Apparatus Feed Flow Change in component concentrations during filtration (by HPLC, UV, and Raman) Raman Probe Averaged 5 spectra centered on the median of the sample spectra NeSSI Block Permeate Flow • Manually measure flow rate and collect samples very 15 minutes • Collected samples were analyzed by UV and HPLC to determine lignin and sugar concentrations Pressure Gauge CONCLUSIONS Experimental • 500 mL synthetic biorefinery solution; 1% concentration each of lignosulfonate, glucose, and xylose • Polysulfone membrane with 5,000 and 10,000 Dalton molecular weight cut off (from Pall) • Membrane pressure was ~2 bar with 40 mL/min feed flow rate, ambient temperature. Retentate returned to feed reservoir • Raman data collected on membrane permeate with Kaiser HoloPro Instrument • 5 second exposure, 10 accumulations • 5000 Dalton membranes provides good separation of sugars from lignin • 10,000 Dalton membrane gave similar performance • Lignin data shows there is an optimal point to concentrate process stream • Raman spectroscopy promising method for biorefinery process stream measurements • Lignin concentration determined by Raman correlates well with determination using UV spectroscopy • Sugar analysis not yet to be completed but previous work shows feasibility Analytical methods FUTURE WORK • UV-VIS spectrophotometer (lignin content) • Sample diluted 500 fold with deionized water, and absorbance measured at 280 nm • Ion Chromatography System (ICS- 3000) (monomer sugar content) • 50 μl of sample mixed with 950 μlepure water and 50 μlfucose was injected to HPLC for sugar concentration analysis • Volumetric method (flux rate) • Record the permeate volume per minute in every 15 minutes interval • Flux rate J=V/t· area ( L / h· m2) • Optimize membrane separation of sugars and lignin • Optimal pore size and operating conditions • Expand research to real process streams, with greater potential for fouling • Develop fundamental model of membrane separation • Apply data from Raman measurements to develop model • Optimize membrane separation of lignin and hemicellulose polymers Hong Lin Acknowledgements: CPAC and Consortium for Plant Biotechnology Research