Download
1 / 34
340 likes | 452 Views
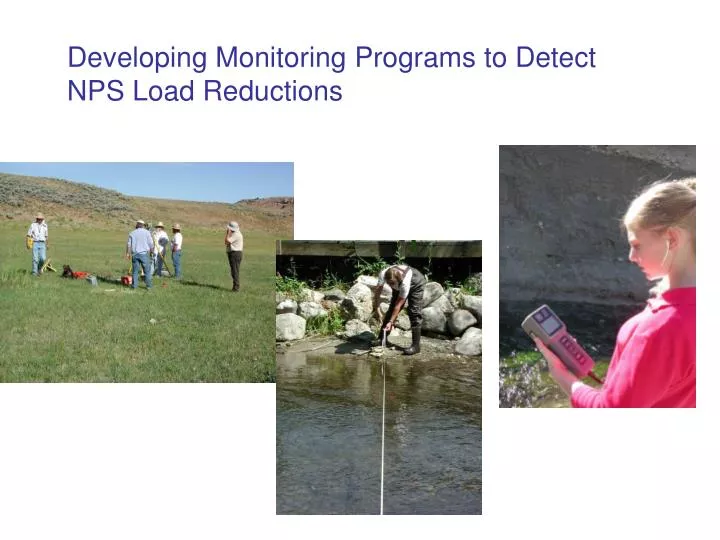
Developing Monitoring Programs to Detect NPS Load Reductions. Monitoring objective?. What to monitor, how often, where, who will do the monitoring and the monitoring techniques are all determined by the objective of the monitoring program. UPDES compliance? Educational?A

E N D
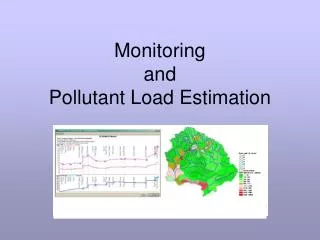
Developing Monitoring Programs to Detect NPS Load Reductions
Monitoring objective? • What to monitor, how often, where, who will do the monitoring and the monitoring techniques are all determined by the objective of the monitoring program. • UPDES compliance? • Educational?A • Assessment for impairment? • Load reduction?
Understand the pollutant(s) of concern • How does the pollutant move from the source to the waterbody? • How is the pollutant processed or transformed within a waterbody? • What is the natural variability of the pollutant? Will concentrations change throughout a season? Throughout a day? • What long term changes within your watershed may also affect this pollutant?
To detect impact of a BMP, you need to monitor at the appropriate scale.
What is the best approach to take to monitor load reduction? Suspended sediment? Bedload? Grab? Integrated? • Monitoring the pollutant(s) of concern? • Monitoring “surrogates” • Monitor a response variables? • Model the pollutant of concern? • Model response variables? Turbidity? Embededdness, algae, macroinvertebrates, redds PSIAC, AGNPS, etc.
What other information do you need to tell the whole story? For example…. pH? Temperature? Dissolved oxygen? Flow?
Site selection Want to “capture” effect of your project Want to avoid as many other influences as possible
Above and below treatment Above-practice monitoring stations Management practice Below-practice monitoring stations
Single watershed, before-after Before treatment After treatment Sampling points
Two different watersheds Sampling points
Prior to treatment - calibration Sampling points
After treatment Control Treatment “A” Sampling points
Treatment 2 Sampling point Treatment 1
Before you establish actual monitoring sites Think about… • Where in the stream should you monitor? • Equipment limitations? • Legal and safe access? • Holding times of your samples?
When to collect samples? Consider: Seasonality? Flow? Night versus day? Storm events versus base flow? Discrete samples versus continuous samples?
How many samples need to be collected? • Consider…. • Statistical tests to be used • The smaller the change, the more samples you will need • High precision requires more samples • Your willingness to be wrong
Finally….collecting samples! Standard operating procedures Calibration of equipment Quality assurance / quality control Chain of custody in samples Holding times Make sure field people understand what’s going on
Data management Field sheets Electronic storage Hard copy or back up data Metadata QA/QC
Using the data Summary statistics Graphical results….pictures tell a lot Trends Comparative statistics Use the data to revise monitoring program
Above-and-below watersheds • Essentially “nested”watersheds • Monitor above and below the practice • Best if monitored before and after the practice is implemented • Advantages- - not as subject to temporal or climate variability - generally easy to find an acceptable watershed
Above-and-below watersheds • Disadvantages - measurements from above and below are not independent - differences might be caused by spatial variability (soils, vegetation, geology) and not by the practice - measurements made before applying the practice might reduce this problem • Statistics – paired t-test, regression analysis
Single watershed, before-after • Water quality monitoring carried out at a single point before a management practice is applied, then again after application • Advantages -extremely simple, can be used on any watershed -uses only one monitoring station
Singlewatershed,before-after • Disadvantages - can’t separate climate or other influences from possible BMP effects - results can’t be applied to other watersheds • Not a recommended design • Statistics – two-group t-test, multiple regression might clarify climate interactions
Two different watersheds • Compare two watersheds, one with the practice and one without • Not the same as a paired watershed, and should not be used • Advantages – none • Disadvantages - not controlled, can lead to erroneous conclusions - differences may be caused by inherent differences in watersheds, the practice, or both
Paired watersheds • Compares one or more pairs of similar watersheds • Calibration period- watersheds are treated identically and paired water quality collected • Treatment period- one watershed in the pair is selected to receive treatment, the other is a control
Guidelines for paired watersheds • Steady-state – no ongoing changes that affect water quality • Size- should be small enough to treat uniformly • Calibration period- should be long enough to develop significant relationships the watersheds • Response- treatment should yield a response that would be larger than expected by chance • Similarity- watersheds need not be identical, but should be similar • Suitability- stable channel, stable control section
Paired watersheds • Advantages - outside influences such as climate are statistically controlled - control eliminates need to measure all mechanisms contributing to response
Paired watersheds • Disadvantages - unequal variances in data can make statistical analysis complicated - treatment effects can be too gradual to measure accurately - expensive, requires long term commitment - unplanned catastrophes can ruin a long-term project • Statistics – regression, analysis of covariance
Multiple watersheds • Involves more than two watersheds • Treatments can already be in place or randomly assigned • Advantages - results can be applied across a region - true variability among watersheds is included in data analysis
Multiple watersheds • Disadvantages - difficult to use with intermittent sources - logistics • Statistics- two-group t-test
Trend stations • Single watersheds monitored over time • Advantages - relatively easy to establish - can spot problems while they can still be remedied
Trend stations • Disadvantages - need a true long-term commitment - need to track changes in land use - possibility of major disruptions (roads, urban development) • Statistics- regression, trend analysis, t-tests, ANOVA
What other information do you need to tell the whole story? For example…. pH? Temperature? Dissolved oxygen? Flow?