Download
1 / 1
10 likes | 121 Views
Ashton Verdery ■ Carolina Population Center ■ The University of North Carolina at Chapel Hill 2008. Adjusting for Adjustment: Impacts of the Assimilation, Adaptation, Disruption and Selection Hypotheses of Migrant Demographic Adjustment in a Context of Regional Variation, the Case of Russia.

E N D
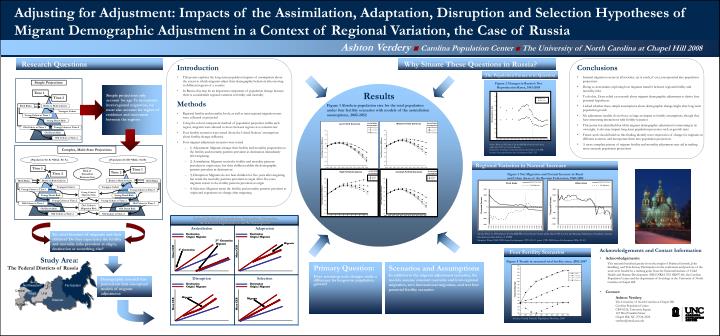
Ashton Verdery■Carolina Population Center ■ The University of North Carolina at Chapel Hill 2008 Adjusting for Adjustment: Impacts of the Assimilation, Adaptation, Disruption and Selection Hypotheses ofMigrant Demographic Adjustment in a Context of Regional Variation, the Case of Russia Research Questions Why Situate These Questions in Russia? Introduction • This poster explores the long-term population impacts of assumptions about the extent to which migrants adjust their demographic behaviors after moving to different regions of a country • In Russia, this may be an important component of population change because there is considerable regional variation in fertility and mortality Methods • Regional fertility and mortality levels, as well as inter-regional migration rates were collected or projected • Using the cohort component method of population projection within each region, migrants were allowed to move between regions at a constant rate • Four fertility scenarios were tested (from the United Nations’ assumptions about fertility change in Russia) • Four migrant adjustment scenarios were tested • 1) Adjustment: Migrants change their fertility and mortality propensities to the fertility and mortality patterns prevalent at destination immediately after migrating • 2) Assimilation: Migrants retain the fertility and mortality patterns prevalent in origin areas, but their children exhibit the demographic patterns prevalent in destinations • 3) Disruption: Migrants do not bear children for five years after migrating but retain the mortality patterns prevalent at origin After five years migrants return to the fertility patterns prevalent at origin • 4) Selection: Migrants retain the fertility and mortality patterns prevalent at origin and experience no change after migrating Conclusions • Internal migration occurs in all societies, yet is rarely, if ever, incorporated into population projections • Doing so necessitates exploring how migrants transfer between regional fertility and mortality risks • To do this, I have relied on research about migrant demographic adjustment to derive four potential hypotheses • I asked whether these simple assumptions about demographic change might alter long-term population growth • My adjustment models do not have as large an impact as fertility assumptions, though they have interesting interactions with fertility scenarios • This poster has identified that while migrant demographic adjustment is interesting in its own right, it also may impact long-term population processes such as growth rates • Future work should build on this finding, identify truer trajectories of change for migrants in different contexts, and incorporate them into population projections • A more complete picture of migrant fertility and mortality adjustment may aid in making more accurate population projections The Population Future is in Question Simple Projections Figure 2 Changes in Russia’s Net Reproduction Rates, 1961-2005 Simple projections only account for age To incorporate inter-regional migration, we must also account for region of residence and movement between the regions Results Time 1 2.00 Time 2 1.80 Rural Areas Urban Areas 1.60 Figure 1 Absolute population size for the total population under four fertility scenarios with models of the assimilation assumptions, 2002-2052 Birth Risks Births to Both Cohorts 1.40 Youngest Cohort 1.20 Net Reproductive Rate Young Cohort at Time 1 1.00 Young Death Risk 0.80 0.60 Old Cohort at Time 1 Young Cohort at Time 2 0.40 Old Death Risk 0.20 Old Cohort at Time 2 0.00 1962 1965 1968 1971 1974 1977 1980 1983 1986 1989 1992 1995 1998 2001 2004 Notes: Prior to 1992 data is for the RSFSR of the Soviet Union while after 1992 it is for the Russian Federation A hashed, vertical line denotes dissolution of USSR Sources: Net reproduction rate: Goskomstat 2005: 133 Complex, Multi-State Projections (Population Set A) *(Risk Set A) (Population Set B) *(Risk Set B) Regional Variation in Natural Increase Time 1 Time 1 Risk of Transition Between Sets Time 2 Assimilation Assimilation Time 2 High Fertility Scenarios Constant Fertility Scenarios Figure 3 Net Migration and Natural Increase in Rural and Urban Areas of the Russian Federation, 1960-2005 Assumptions Assumptions Assimilation Adaptation Adaptation Assimilation 180 180 Selection Disruption Births to Both Cohorts Births to Both Cohorts Birth Risks Birth Risks Disruption Selection Natrural Increase Natural Increase Rural Areas Urban Areas 170 170 Net Migration Net Migration Youngest Cohort Youngest Cohort 160 160 Young Cohort at Time 1 Young Cohort at Time 1 1500 1500 Young Cohort’s Migration Risk 150 150 Young Death Risk Young Death Risk 1000 1000 Total Population (Millions) Total Population (Millions) 140 140 Young Cohort at Time 2 Young Cohort at Time 2 1960 1962 1964 1966 1968 1970 1972 1974 1976 1978 1980 1982 1984 1986 1988 1990 1992 1994 1996 1998 2000 2002 2004 1960 1962 1964 1966 1968 1970 1972 1974 1976 1978 1980 1982 1984 1986 1988 1990 1992 1994 1996 1998 2000 2002 2004 130 130 500 500 Old Cohort at Time 1 Old Cohort at Time 1 Old Cohort‘s Migration Risk Thousand Persons 120 120 Thousand Persons 0 0 Old Death Risk Old Death Risk 110 110 -500 -500 Old Cohort at Time 2 Old Cohort at Time 2 100 100 2002 2007 2012 2017 2022 2027 2032 2037 2042 2047 2052 1 2 3 4 5 6 7 8 9 10 11 Stylized Models of Assimilation, Adaptation, Disruption Stylized Models of Assimilation, Adaptation, Disruption -1000 -1000 & Selection Hypotheses Used As Assumptions & Selection Hypotheses Used As Assumptions -1500 -1500 Assimilation Adaptation Yet, what becomes of migrants and their children? Do they experience the fertility and mortality risks prevalent at origin, destination or something else? Notes: Prior to 1992 data is for the RSFSR of the Soviet Union while after 1992 it is for the Russian Federation A hashed, vertical line denotes dissolution of USSR Sources: Years 1960-1989 from Goskomstat 1999: 20-21; years 1990-2005 from Goskomstat 2006, 21-22 Destination Destination Destination Destination Origin/ Migrants Origin/ Migrants Origin/ Migrants Origin/ Migrants nd nd 2 2 Generation Generation Migrants Migrants Migrants Migrants Acknowledgements and Contact Information • Acknowledgements: This research benefited greatly from the insight of Barbara Entwisle, John Sandberg, and Tom Swasey Participation in the conference and portions of the work were funded by a training grant from the National Institute of Child Health and Human Development (NIH/NRSA T32 HD07168), the Carolina Population Center and the department of Sociology at the University of North Carolina at Chapel Hill • Contact: Ashton Verdery The University of North Carolina at Chapel Hill Carolina Population Center CB# 8120, University Square 123 West Franklin Street Chapel Hill, NC 27516-2524 verdery@email.unc.edu Four Fertility Scenarios st st 1 1 Generation Generation Mean CEB Mean CEB Mean CEB Mean CEB Study Area: The Federal Districts of Russia Figure 4 Trends in assumed total fertility rates, 2002-2047 Primary Question: Does assuming such changes make a difference for long-term population growth? Scenarios and Assumptions In addition to the migrant adjustment scenarios, the models assume constant mortality and inter-regional migration, zero international migration, and test four potential fertility scenarios Disruption Selection Demographic research has pointed out four conceptual models of migrant adjustment: Destination Destination Destination Destination Northwestern Far Eastern Origin/ Migrants Origin/ Migrants Origin/ Migrants Origin/ Migrants Central Volga Ural Migrants Migrants Migrants Migrants Siberian Southern Mean CEB Mean CEB Mean CEB Mean CEB Source: United Nations Population Division, 2006