Download
1 / 18
180 likes | 332 Views
SEPARATION AND DETECTION OF PROTEINS Part I Vlasta Němcová, Michael Jelínek, Jan Šrámek. Identification of actin , microfilamentum structure of the cell cytoskeleton by 2 methods :. detection directly in the cells - fluorescent staining

E N D
SEPARATION AND DETECTION OF PROTEINSPart IVlasta Němcová,Michael Jelínek,Jan Šrámek
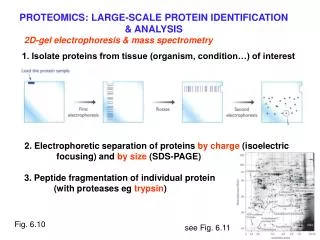
Identification of actin, microfilamentum structure of the cell cytoskeleton by 2 methods: • detection directly in the cells- fluorescent staining • detection following isolation and separation of proteins- SDS-PAGE(sodium dodecylsulfate polyacrylamide gel electrophoresis)
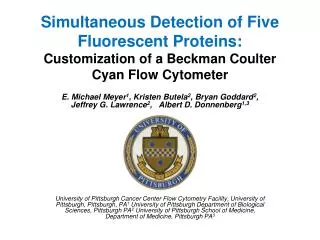
METHOD 1:Fluorescent staining of F-actin, G-actin and DNA • F-actin:phalloidinconjugated with TRITC • G-actin:DNase I conjugated with Alexa Fluor 488 • DNA:DAPI • cells used – cell line NES2Y(human -cells ofLangerhans islets)
Fixation – first step of sample preparation • preserve the tissue from decay, either through autolysis or putrefaction • purpose - to preserve the biological material (tissue or cells) as close to its natural state as possible in the process of preparing samples for examination Formaldehyde • creats covalent chemical bonds between proteins in tissue • anchors soluble proteins to the cytoskeleton • tissue becomes more rigid (easier manipulation)
Protocol: • fixation of the cellsusing solution of formaldehyde in PBS (phosphate buffered saline) • removal of formaldehyde solution from the cells by repeated wash with PBS • incubation with phalloidin-TRITC and DNase I-Alexa Fluor 488 • removal ofunbound phalloidin-TRITC and DNase I-Alexa Fluor 488 byrepeated wash with PBS • staining with DAPI • observation under fluorescent microscope
METHOD 2:Comparison of actin and myosin expression in different types of tissues - by SDS-PAGE(sodium dodecylsulfate polyacrylamide gel electrophoresis)Isolation of proteins from different tissues: • tissues used: • muscle • heart • liver
Isolation of proteins from cells and tissues: • first step – desintegration of the tissue and cells • desintegration (=lysis) of cells • chemical(we use in our experiment) • mechanical • physical
Protocol: Isolation of proteins • transfer of a tissue sample into atube • desintegration of the tissue by a lysis buffer containing SDS (sodium dodecylsultate) • separation of the lysate containing proteins from tissue fragments by centrifugation Determination of protein concentration • by the Bradford method • using BSA (bovine serum albumine) as a standard for calibration curve construction
Separation of proteins by the SDS-PAGE method • boiling of the samples with sample buffercontaining SDS • loading the samples containing desired amount of protein onto a polyacrylamide gel • separation of proteins by vertical gel electrophoresis Identification of actin and myosin • staining of the gel with the separated proteinsin Coomassieblue solution • detection of localization of actin and other proteins in SDS-PAGE, comparison of actin and myosin expression among tissues
Determination of protein concentration: • several methods are routinely used • all of the listed methods rely on the use of a spectrophotometer (measurement of absorbance) • the Bradford assay(we use in our experiment) • Lowry assay • BCA assay (Bicinchoninic assay) • ultraviolet absorbance assay, etc.
Principle of the Bradford method • colorimetric assay based on absorbance shift of Bradford reagent that occurs after its binding to proteins • Bradford reagent contains CoomassieBrilliant Blue G-250 dye thatbinds to basic and aromatic amino acid residues(arginine (ARG), fenylalanin (PHE), tryptophan (TRY) a prolin (PRO)
Coomassie Brilliant Blue G-250 • when the dye binds to proteins, it is converted to blue color • the amount of this blue form is detected at 595 nm to quantify the concentration of proteins
Bradford assay • preparation of standards for construction of a calibration curve – several samples with known concentration of protein (bovine serum albumine = BSA dissolved in water is routinely used) • dilution of our sample (lysate) with unknown concentrationto fit into the concentration range of the calibration curve • incubation of standards and our samples with Bradford reagent • absorbance measurement (A595) • construction of acalibration curve • determination of protein concentration in the lysate using the calibration curve
Another methods for protein determination: The Lowry assay • based on detection of tyrosine and tryptophan residues • blue color is developed and detectable with a spectrophotometer in the range of 500-750 nm
Ultraviolet absorbance assay • determination of protein concentration by ultraviolet absorption (260 to 280 nm) • depends on the presence of aromatic amino acids in proteins (tyrosine and tryptophan) • [Protein] (mg/mL) = 1.55*A280 - 0.76*A260
BCA method • BCA = bicinchoninic acid • the peptide bond itself is responsible for color development • purple color is detectable at 562 nm