Download
1 / 1
10 likes | 137 Views
3D CTM Study of 2002/03 Arctic Winter Ozone Loss and Early December Mini-hole Event Wuhu Feng 1 , Martyn Chipperfield 1 , Howard Roscoe 2 , Mike Fromm 3 1. School of the Environment, University of Leeds, U.K 2. British Antarctic Survey, Cambridge, U.K.

E N D
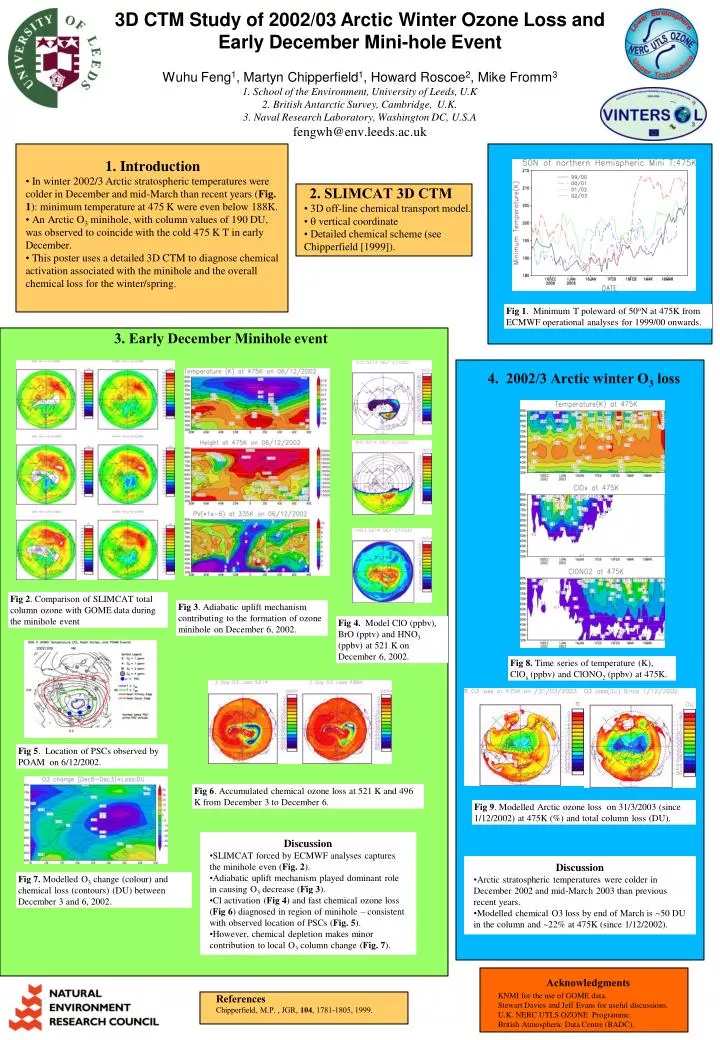
3D CTM Study of 2002/03 Arctic Winter Ozone Loss and Early December Mini-hole Event Wuhu Feng1, Martyn Chipperfield1, Howard Roscoe2, Mike Fromm3 1. School of the Environment, University of Leeds, U.K 2. British Antarctic Survey, Cambridge, U.K. 3. Naval Research Laboratory, Washington DC, U.S.A fengwh@env.leeds.ac.uk • 1. Introduction • In winter 2002/3 Arctic stratospheric temperatures were colder in December and mid-March than recent years (Fig. 1): minimum temperature at 475 K were even below 188K. • An Arctic O3 minihole, with column values of 190 DU, was observed to coincide with the cold 475 K T in early December. • This poster uses a detailed 3D CTM to diagnose chemical activation associated with the minihole and the overall chemical loss for the winter/spring. 2. SLIMCAT 3D CTM • 3D off-line chemical transport model. • vertical coordinate • Detailed chemical scheme (see Chipperfield [1999]). Fig 1. Minimum T poleward of 50oN at 475K from ECMWF operational analysesfor 1999/00 onwards. 3. Early December Minihole event 4. 2002/3 Arctic winter O3 loss Fig 2. Comparison of SLIMCAT total column ozone with GOME data during the minihole event Fig 3. Adiabatic uplift mechanism contributing to the formation of ozone minihole on December 6, 2002. Fig 4. Model ClO (ppbv), BrO (pptv) and HNO3 (ppbv) at 521 K on December 6, 2002. Fig 8. Time series of temperature (K), ClOx (ppbv) and ClONO2 (ppbv) at 475K. Fig 5. Location of PSCs observed by POAM on 6/12/2002. Fig 6. Accumulated chemical ozone loss at 521 K and 496 K from December 3 to December 6. Fig 9. Modelled Arctic ozone loss on 31/3/2003 (since 1/12/2002) at 475K (%) and total column loss (DU). • Discussion • SLIMCAT forced by ECMWF analyses captures the minihole even (Fig. 2). • Adiabatic uplift mechanism played dominant role in causing O3 decrease (Fig 3). • Cl activation (Fig 4) and fast chemical ozone loss (Fig 6) diagnosed in region of minihole – consistent with observed location of PSCs (Fig. 5). • However, chemical depletion makes minor contribution to local O3 column change (Fig. 7). • Discussion • Arctic stratospheric temperatures were colder in December 2002 and mid-March 2003 than previous recent years. • Modelled chemical O3 loss by end of March is ~50 DU in the column and ~22% at 475K (since 1/12/2002). Fig 7. Modelled O3 change (colour) and chemical loss (contours) (DU) between December 3 and 6, 2002. Acknowledgments KNMI for the use of GOME data. Stewart Davies and Jeff Evans for useful discussions. U.K. NERC UTLS OZONE Programme. British Atmospheric Data Centre (BADC). References Chipperfield, M.P. , JGR, 104, 1781-1805, 1999.