Download
1 / 21
230 likes | 630 Views
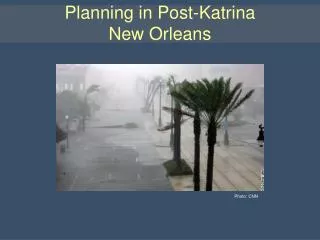
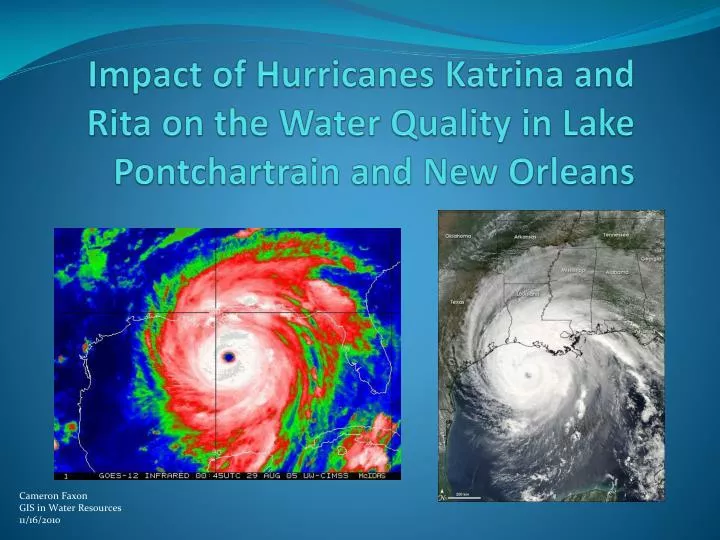
Impact of Hurricanes Katrina and Rita on the Water Quality in Lake Pontchartrain and New Orleans. Cameron Faxon GIS in Water Resources 11/16/2010. Hurricane Katrina (category 3). Date of Landfall: August 29 th Point of Landfall: Buras, LA Approximately 1200 deaths

E N D
Impact of Hurricanes Katrina and Rita on the Water Quality in Lake Pontchartrain and New Orleans Cameron Faxon GIS in Water Resources 11/16/2010
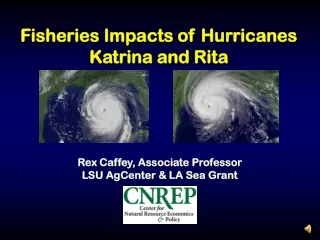
Hurricane Katrina (category 3) • Date of Landfall: August 29th • Point of Landfall: Buras, LA • Approximately 1200 deaths • 10-20 feet over normal tide levels
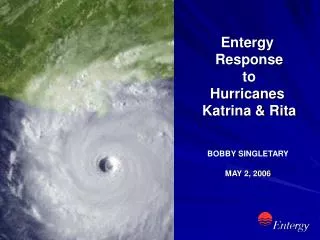
Hurricane Rita (category 3) • Date of Landfall: September 24th • Point of Landfall: Sabine Pass/Johnson’s Bayou • 90 tornadoes • Up to 10-15 inches of rain
Observations from Rigolets Site (2004-2010) • Average gage height increase
Water Quality at Rigolets (2004-2010) • Slight elevation of salinity and specific conductance • ≈Oct 2005-Jan 2008
Coliform Bacteria • Members of the Enterobacteriaceaefamily • Gram-negative, non-spore forming • Rod shaped morphology • Presence indicates pathogen presence is possible • Bacterial, viral and parasitic Enterobacter Citrobacter
Fecal Coliform Bacteria Contamination • W.H.O. designates E. coli as primary fecal contamination indicator bacteria • USEPA Maximum Recommended Levels: • Recreational use: 200 cfu/100ml • Fishing/Boating: 1000 cfu/100ml • Drinking water: 1 cfu/100ml • Biosolids (residential): 1000 cfu/g E. coli Klebsiella
History of Coliform Contamination at Pontchartrain Beach • Maximum observedfecal coliforms (cfu/100ml): • 1600 (2004/2007) • 170 (2008) • 540 (2009)
Region 6 Katrina Emergency Monitoring Data Average: 101,778cfu/(g-sediment) Maximum: 1,115,800 cfu/(g-sediment)
Results of Post-Rita Sediment Sampling Average: 86335 cfu/100ml Maximum: 529140 cfu/100ml
Results of Post-Rita Sampling Water Sampling Average: 7443cfu/100ml Maximum: 76000 cfu/100ml
Conclusions • Significantly elevated fecal coliform levels in sediment and water near populated areas • Extremely high fecal coliform levels in areas that drain into lake Pontchartrain • Before flooding: • Highest observed levels were 8 times EPA recommended maximums for body-contact water use (Pontchartrain Beach). • After flooding: • Average water samples had were > 37 times EPA recommended maximums (body contact) • Average sediment samples after Katrina were > 86 times EPA recommended maximums (biosolids)
Further work • Include salinity measurements • Include dissolved oxygen levels • Analyze these parameters to find correlation between data and storm surge/flooding. • Estimate total volume increase in lake from storm surge.
References • Works Cited • Brandys, Dr. Bob. H. Quantifying Bacteria Levels in Water Categories 1-3. Hinsdale, Illinois: Occupational and Environmental Health Consulting Services Inc., 2007. • Campanella, Catherine. "New Orleans History~~Lake Pontchartrain." 15 January 2000. 29 September 2010 <http://www.stphilipneri.org/teacher/pontchartrain/section.php?id=79>. • Cobos-Roa, Robert Bea and Diego. "Failure of the I-Wall Flood Protection Structures at the New Orleans Lower 9th Ward During Hurricane Katrina." Electronic Journal of Geotechnical Engineering, Vol. 13 (2008): 1-43. • Furey, John S. "Post-Katrina Fecal Contamination in Violet Marsh near New Orleans." International Journal of Environmental Research and Public Health, 4(2) (2007): 84-92. • "How could coliform bacteria affect water quality?" 2010. APEC presents: Free Drinking Water.com. 15 November 2010 <http://www.freedrinkingwater.com/water_quality/quality1/1-how-coliform-bacteria-affect-water-quality.htm>. • Jeff Schmaltz, MODIS Rapid Response Team at NASA GSFC. Visible Earth: A catalog of NASA images and animations of our home planet. 24 August 2005. 15 November 2010 <http://visibleearth.nasa.gov/view_rec.php?id=17314>. • Light Rail Now! News Log. 21 September 2005. 15th November 2010 <http://www.lightrailnow.org/news/n_newslog004.htm>. • NASA. "NASA Facilities Weather Hurricane Rita." 27 September 2005. NASA Official Web Site. 15 November 2010 <http://www.nasa.gov/vision/earth/lookingatearth/rita_main.html>. • NOAA. Hurricane Preparedness: Hurricane History. 2010. 15 November 2010 <http://www.nhc.noaa.gov/HAW2/english/history.shtml>. • Oram, Brian. "Fecal Coliform Bacteria in Water." Water Research Center. 15 November 2010 <http://www.water-research.net/Watershed/fecalbacteria.htm>. • Pesce, Katie. "Hurricane Katrina: Levee Breaches." 2010. Mission 2010: New Orleans. 9 November 2010 <http://web.mit.edu/12.000/www/m2010/finalwebsite/katrina/damage/damage-leveebreach.html>. • Punsalan, Derek. {saltwater intrusion} lake pontchartrain. 2 February 2010. • Wikipedia. "Mississippi River - Gulf Outlet Canal." 23 September 2010. Wikipedia. 29 September 2010 <http://en.wikipedia.org/wiki/Mississippi_River_%E2%80%93_Gulf_Outlet_Canal>.