Download
1 / 51
510 likes | 514 Views
This document provides a list of performance measures for a hospital job training school fire department, including measures of quality, quantity, effect, and effort, as well as population and performance accountability measures. It also includes a guide on selecting headline measures and developing a data development agenda.

E N D
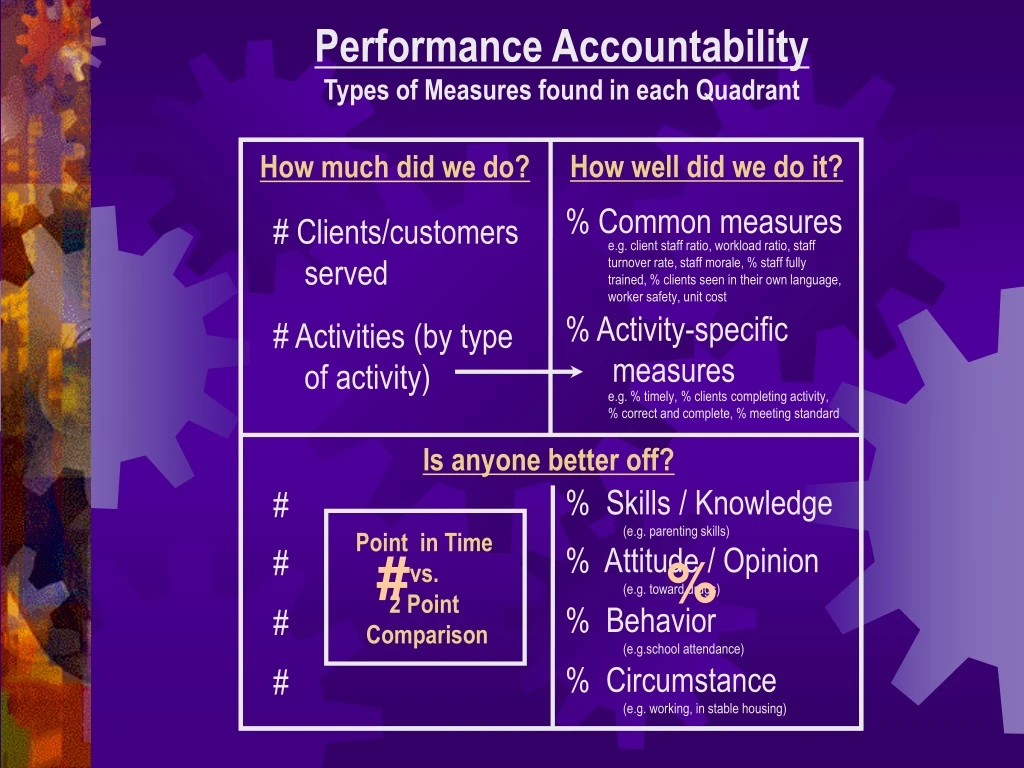
% Common measures e.g. client staff ratio, workload ratio, staffturnover rate, staff morale, % staff fully trained, % clients seen in their own language,worker safety, unit cost % Activity-specific measures e.g. % timely, % clients completing activity, % correct and complete, % meeting standard % Skills / Knowledge (e.g. parenting skills) # % Attitude / Opinion (e.g. toward drugs) # Point in Timevs.2 Point Comparison % Behavior (e.g.school attendance) # % Circumstance (e.g. working, in stable housing) # Performance AccountabilityTypes of Measures found in each Quadrant How well did we do it? How much did we do? # Clients/customers served # Activities (by type of activity) Is anyone better off? # %
Service: __________________________________ Hospital Job Training School Fire Department How well did we do it? How much did we do? Primary customers Unit cost persons trained patients students # Workload ratio Primary activity % of ___x___ that happen on time job courses alarms responded to diagnostic tests hours of instruction # Is anyone better off? If your service works really well,how are your customer's better off? # students who graduate persons who get jobs patients who fully recover fires kept to room of origin %
Choosing Headline Measures and theData Development Agenda Quality Quantity How well did we do it? How much did we do? #3 DDA # Measure 1 ---------------------------- # Measure 2 ---------------------------- # Measure 3 ---------------------------- # Measure 4 ---------------------------- # Measure 5 ---------------------------- # Measure 6 ---------------------------- # Measure 7 ---------------------------- % Measure 8 ---------------------------- % Measure 9 ----------------------------- % Measure 10 --------------------------- % Measure 11 --------------------------- % Measure 12 --------------------------- % Measure 13 --------------------------- % Measure 14 --------------------------- #2 Headline Effect Effort Is anyone better off? #2 DDA # Measure 15 ---------------------------- # Measure 16 ---------------------------- # Measure 17 ---------------------------- # Measure 18 ---------------------------- # Measure 19 ---------------------------- # Measure 20 ---------------------------- # Measure 21 ---------------------------- % Measure 15 ---------------------------- % Measure 16 ---------------------------- % Measure 17 ---------------------------- % Measure 18 ---------------------------- % Measure 19 ---------------------------- % Measure 20 ---------------------------- % Measure 21 ---------------------------- #3 Headline #1 Headline #1 DDA
LR UR Baseline & Story Primary v. Secondary Direct v. Indirect Internal v. External
Select 3 to 5 Performance MeasuresACROSS THE BOTTOM OF THE ORG CHART 3 - 5 3 - 5 3 - 5 3 - 5 3 - 5 3 - 5 3 - 5 3 - 5 3 - 5 3 - 5 3 - 5 20 – 60 – 20 Rule
THE LINKAGE Between POPULATION and PERFORMANCE POPULATION ACCOUNTABILITY Healthy Births Rate of low birth-weight babiesChildren Ready for SchoolPercent fully ready per K-entry assessmentSelf-sufficient FamiliesPercent of parents earning a living wage PERFORMANCE ACCOUNTABILITY POPULATIONRESULTS Contributionrelationship Alignmentof measures Job Training Program Unit costper persontrained # personsreceivingtraining Appropriateresponsibility % who getliving wage jobs # who getliving wage jobs CUSTOMERRESULTS
2 …and it had a timely relationship to…. 3 …. a turn in the curve. Curve Turn Evaluation Methodology (CTEM)DEMONSTRATING the CONTRIBUTIONof complex change efforts… requires 3 elements: Bonus: a background trend stayed the same or got worse. 4 A Curve to Turn 1 We tried a bunch of stuff that had a credible chance of making a difference … c FPSI
Performancemeasure PopulationIndicator
Population Accountability Result: to which you contribute to most directly. Indicators: Story: Every timeyou presentyour program, Use atwo-partapproach. Partners: What would it take?: Your Role: as part of a larger strategy. Your Role Performance Accountability Program: Performance measures: Story: Partners: Action plan to get better:
Population Accountability Result: to which you contribute to most directly. Indicators: Shortcut Story: Every timeyou presentyour program, Use atwo-partapproach. Partners: What would it take?: Your Role: as part of a larger strategy. Your Role Performance Accountability Program: Performance measures: Story: Partners: Action plan to get better:
Different Kinds of Progress 1. Data a. Population indicators Actual turned curves: movement for the better away from the baseline. b. Program performance measures: customer progress and better service: How much did we do? How well did we do it? Is anyone better off? 2. Accomplishments: Positive activities, not included above. 3. Stories behind the statistics that show how individuals are better off.
Board of Directors MeetingAGENDA 1. New data 1. New data 2. New story behind the curves 2. New story behind the curves 3. New partners 3. New partners 4. New information on what works. 4. New information on what works. 5. New information on financing 5. New information on financing 6. Changes to action plan and budget 6. Changes to action plan and budget 7. Adjourn 7. Adjourn
RBA in a Nutshell2 – 3 - 7 plus language discipline Results & Indicators Performance measures 2 - kinds of accountability Population accountability Performance accountability 3 - kinds of performance measures. How much did we do? How well did we do it? Is anyone better off? 7 - questions from ends to means in less than an hour. Baselines & Turning the Curve
“If you do what you always did,you will get what you always got.” Kenneth W. JenkinsPresident, Yonkers NY NAACP
2014 2016 2018 2020 2022
2014 2016 2018 2020 2022
2014 2016 2018 2020 2022
2013 2014 2016 2018 2020 2022
2014 2016 2018 2020 2022
2018 2020 2022 AECF Kids Count Data Center
65% Now Creating a Working Baselinefrom Group Knowledge Indicator or Performance Measure Not OK? Forecasting Backcasting
Turn the Curve Exercise: Population Well-being 5 min: Starting Points- timekeeper and reporter- geographic area- two hats (yours plus partner’s) 10 min: Baseline- pick a result and a curve to turn- forecast (to 2022) – OK or not OK? 15 min: Story behind the baseline- causes/forces at work- information & research agenda part 1 - causes Two pointers to action 15 min: What works? (What would it take?)- what could work to do better?- each partners contribution- no-cost / low-cost ideas- information & research agenda part 2 – what works 10 min: Reportconvert notes to one page
Turn the Curve Exercise: Program Performance 5 min: Starting Points- timekeeper and reporter- identify a program to work on- two hats (yours plus partner’s) 10 min: Performance measure baseline-choose 1 measure to work on – from the lower right quadrant- forecast (to 2020) – OK or not OK? 15 min: Story behind the baseline-causes/forces at work- information & research agenda part 1 - causes Two pointers to action 15 min: What works? (What would it take?)-what could work to do better?- each partners contribution- no-cost / low-cost ideas- information & research agenda part 2 – what works 10 min: Reportconvert notes to one page
4. --------- Off the Wall ONE PAGE Turn the Curve Report: Performance Program: _______________ Performance Measure (Lay definition) PerformanceMeasureBaseline Story behind the baseline --------------------------- --------------------------- (List as many as needed) Partners --------------------------- --------------------------- (List as many as needed) Three Best Ideas – What Works1. --------------------------- 2. --------------------------- 3. ---------No-cost / low-cost SharpEdges 4. --------- Off the Wall
4. --------- Off the Wall ONE PAGE Turn the Curve Report: Population Result: _______________ Indicator(Lay Definition) IndicatorBaseline Story behind the baseline --------------------------- --------------------------- (List as many as needed) Partners --------------------------- --------------------------- (List as many as needed) Three Best Ideas – What Works1. --------------------------- 2. --------------------------- 3. ---------No-cost / low-cost SharpEdges 4. --------- Off the Wall
Turn the Curve Exercise – LessonsTalk to Action in an hour 1. How was this different from other processes? What worked and what didn’t work? 2. Why did we ask for: a. Results before indicators? b. Forecast? c. Story? d. No cost / low cost? e. Two hats? f. Crazy idea? g. Only 3 best ideas? 3. Do you think a lay audience could understand the reports? 4. How many think you could lead this exercise with a small group?(2+ curves at the same time)
The Simplest Way TO IMPLEMENT RBA POPULATION ACCOUNTABILITY 1. Pick an important indicator curve 2. Run the Population Turn the Curve Exercise 3. Take action Repeat PERFORMANCE ACCOUNTABILITY 1. Pick an important performance measure curve 2. Run the Performance Turn the Curve Exercise 3. Take action Repeat
Next Steps What’s one thing I can personally do with what I learned today?
Resources www.raguide.org www.resultsaccountability.com RBA Facebook Group Book - DVD Ordersamazon.comclearimpact.org
THANK YOU ! Book - DVD Ordersamazon.comresultsleadership.org
Provision 1. Specify the 3 to 5 most important performance measures (from the How well did we do it? and Is anyone better off? categories). Next Generation ContractingContract Provisions p. 28 Provision 2. Specify that the contractor will use a continuous improvement process (the RBA 7 Questions). Provision 3. Specify how the funder and contractor will work in partnership to maximize LR customer results (quarterly meetings using the 7 questions as the agenda). Provision 4. Specify that the funder will work with the funding community to simplify and standardize contracting and performance reporting.
Next Generation ContractingContract Provisions Provision 5: : Clear articulation of role in population/community well-being using the language of contribution not attribution. Provision 6: 10% for quality management and administration.Provision 7: Multi-year funding using 3 year rolling contracts Provision 8: Use of targets that are fair and useful. Provision 9: Fund flexibility and virtual funding pool: transfer of up to 10% across line items and program lines. Provision 10: Request for Results: Getting past the sometimes negative effects of competitive RFP contracting or tendering.
The Architecture of Accountability Population Accountability Hall Performance Accountability Hall
The Architecture of Accountability Population Accountability Hall Performance Accountability Hall
The Architecture of Accountability Population Accountability Hall Population Accountability Hall