Download
1 / 14
160 likes | 204 Views
Blackout 2003. See: http://energy.gov/oe/downloads/blackout-2003-final-report-august-14-2003-blackout-united-states-and-canada-causes-and. 1. 12:05 Conesville Unit 5 (rating 375 MW) 2. 1:14 Greenwood Unit 1 (rating 785 MW) 3. 1:31 Eastlake Unit 5 (rating: 597 MW). INITIATING EVENT.

E N D
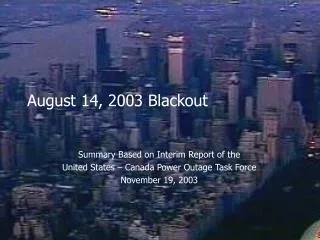
Blackout 2003 See: http://energy.gov/oe/downloads/blackout-2003-final-report-august-14-2003-blackout-united-states-and-canada-causes-and
1. 12:05 Conesville Unit 5 (rating 375 MW) 2. 1:14 Greenwood Unit 1 (rating 785 MW) 3. 1:31 Eastlake Unit 5 (rating: 597 MW) INITIATING EVENT 4. 2:02 Stuart – Atlanta 345 kV 5. 3:05 Harding-Chamberlain 345 kV 6. 3:32 Hanna-Juniper 345 kV 7. 3:41 Star-South Canton 345 kV 8. 3:45 Canton Central-Tidd 345 kV 9. 4:05 Sammis-Star 345 kV SLOW PROGRESSION WHAT HAPPENED ON AUGUST 14, 2003???
1. 12:05 Conesville Unit 5 (rating 375 MW) 2. 1:14 Greenwood Unit 1 (rating 785 MW) 3. 1:31 Eastlake Unit 5 (rating: 597 MW) INITIATING EVENT 4. 2:02 Stuart – Atlanta 345 kV 5. 3:05 Harding-Chamberlain 345 kV 6. 3:32 Hanna-Juniper 345 kV 7. 3:41 Star-South Canton 345 kV 8. 3:45 Canton Central-Tidd 345 kV 9. 4:05 Sammis-Star 345 kV SLOW PROGRESSION 10. 4:08:58 Galion-Ohio Central-Muskingum 345 kV 11. 4:09:06 East Lima-Fostoria Central 345 kV 12. 4:09:23-4:10:27 Kinder Morgan (rating: 500 MW; loaded to 200 MW) 13. 4:10 Harding-Fox 345 kV 14. 4:10:04 – 4:10:45 20 generators along Lake Erie in north Ohio, 2174 MW 15. 4:10:37 West-East Michigan 345 kV 16. 4:10:38 Midland Cogeneration Venture, 1265 MW 17. 4:10:38 Transmission system separates northwest of Detroit 18. 4:10:38 Perry-Ashtabula-Erie West 345 kV 19. 4:10:40 – 4:10:44 4 lines disconnect between Pennsylvania & New York 20. 4:10:41 2 lines disconnect and 2 gens trip in north Ohio,1868MW 21. 4:10:42 – 4:10:45 3 lines disconnect in north Ontario, New Jersey, isolates NE part of Eastern Interconnection, 1 unit trips, 820 mw 22. 4:10:46 – 4:10:55 New York splits east-to-west. New England and Maritimes separate from New York and remain intact. 23. 4:10:50 – 4:11:57 Ontario separates from NY w. of Niagara Falls & w. of St. Law. SW Connecticut separates from New York, blacks out. FAST PROGRESSION (cascade) WHAT HAPPENED ON AUGUST 14, 2003???
Immediate causes of the 8/14/03 blackout 1:30 Loss of East Lake generator (over-excitation) 2:02 Loss of Stuart-Atlanta (tree contact) 2:02 MISO system model becomes inaccurate 2:14-3:08 Loss of software in FE control center 3:05 Loss of Harding-Chamberlain (tree contact) 3:32 Loss of Hanna-Juniper (tree contact) 3:41 Loss of Star-S.Canton (tree contact) 4:06 Loss of Sammis-Star (high overload looked like fault to “zone 3” of the protection system)
Why did MISO system model become inaccurate? From pg. 46: http://energy.gov/oe/downloads/blackout-2003-final-report-august-14-2003-blackout-united-states-and-canada-causes-and
Why did MISO system model become inaccurate? From pg. 47: http://energy.gov/oe/downloads/blackout-2003-final-report-august-14-2003-blackout-united-states-and-canada-causes-and
Why did MISO system model become inaccurate? From pg. 48: http://energy.gov/oe/downloads/blackout-2003-final-report-august-14-2003-blackout-united-states-and-canada-causes-and
Why so much tree-contact? • Trees were overgrown because right-of-ways had not been properly maintained. • Lines expand and sag due to heat; more prone in summer with high temperature & low winds; more prone with high current. • Each successive line trip requires that the power it was carrying be transferred to flow elsewhere, resulting in increased power on remaining lines.
Another influence: insufficient reactive power Another contribution to the blackout was insufficient reactive power in the Cleveland area, i.e., the reactive power (vars) in the Cleveland area generation was insufficient to meet the reactive power demand of its motors. Conditions that make a system prone to this include: • High load, especially induction motors (air conditioners) • Loss of generation in load-intensive area and/or loss of transmission into that load-intensive area This results in voltage decline in the load-intensive area, and because P~VI, when voltage V declines, current I must increase in order to maintain the same power P. When I goes up, lines load up more heavily.
Another influence: Backup protection Zone 3, large delay Zone 2, small delay Zone 1, no delay • Relays sense V/I and trip if it is too low; good approach because fault conditions are low voltage, high current. • Relays are directional; trip only for faults “looking” in one direction. • Zone 1 trips instantly; trip zone for primary protection • Zone 2 has small delay. Zone 3 has large delay; these are trip zones for “backup” protection
Why did the cascade happen (events 10-23) • Underfrequency • Under-voltage • Overexcitation • Out-of-step • Over-voltage • Oscillations in voltages and currents, and/or very high currents caused many transmission line zone 2,3 protection systems to see what appeared to be faults & trip the line. • As a few generators tripped, load>gen imbalance caused underfrequency and lower voltages. • Generators tripped for 1 of following reasons:
Units tripped and areas outaged Some Local Load Interrupted Areas Affected by the Blackout Service maintained in some area The blackout outaged parts of 8 states & Ontario. The blackout shut down 263 power plants (531 units) Total cost: ~10 billion $. Half of DOE annual budget Twice NSF annual budget
Final List of Main Causes • There was inadequate situational awareness at First Energy (FE). FE did not recognize/understand the deteriorating condition of its system. • FE failed to adequately manage tree growth in its transmission rights-of-way. • Failure of the interconnected grid’s reliability organizations (mainly MISO) to provide effective real-time diagnostic support. • FE and ECAR failed to assess and understand the inadequacies of FE’s system, particularly with respect to voltage instability and the vulnerability of the Cleveland-Akron area, and FE did not operate its system with appropriate voltage criteria. • No long-term planning studies w/ multiple contingencies or extreme conditions • No voltage analyses for Ohio area and inappropriate operational voltage criteria • No independent review or analysis of FE’s voltage criteria and operating needs • Some of NERC’s planning & operational requirements were ambiguous