Download
1 / 9
90 likes | 97 Views
Section 13.2 – Comparing 2 sample proportions. We compare populations by performing inference testing on the difference in the population proportions (p 1 – p 2 ). The statistic that estimates this difference is between two sample proportions.

E N D
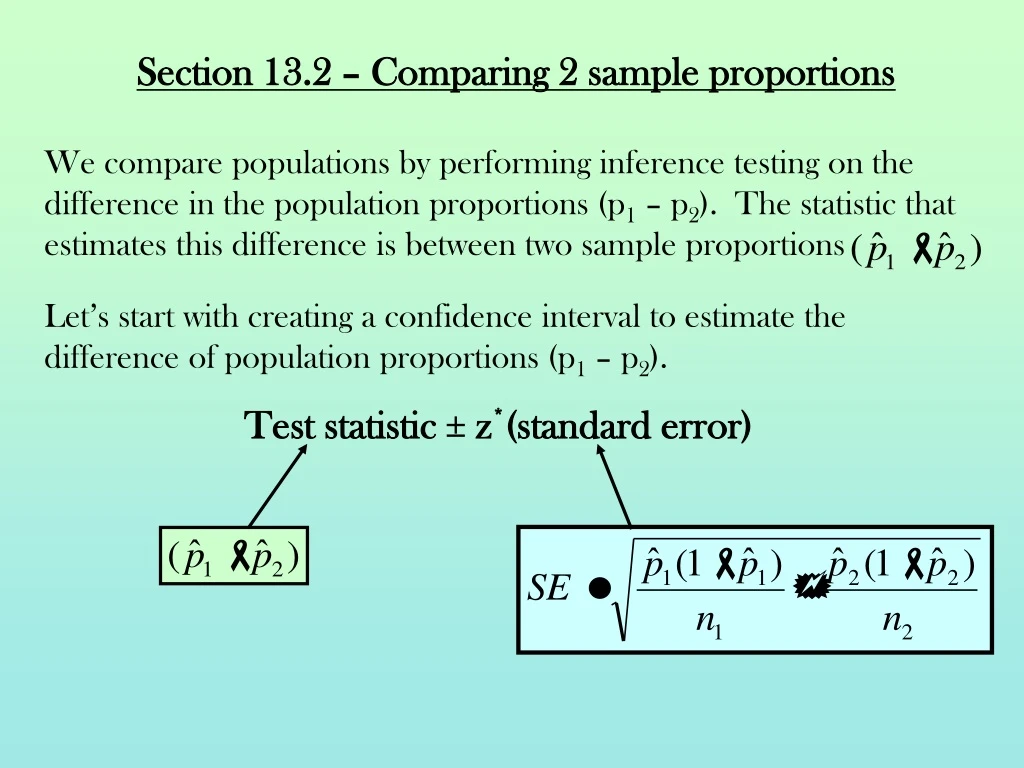
Section 13.2 – Comparing 2 sample proportions We compare populations by performing inference testing on the difference in the population proportions (p1 – p2). The statistic that estimates this difference is between two sample proportions Let’s start with creating a confidence interval to estimate the difference of population proportions (p1 – p2). Test statistic ± z*(standard error)
Conditions for Confidence Interval to Compare 2 Sample Proportions SRS: The 2 samples can be viewed as SRS’s from their respective populations or are the 2 groups in a randomized experiment. Normality: Independence: The two samples are independent. (N ≥ 10nfor each sample)
Example: Do drivers reduce excessive speed when they encounter police radar? On a rural interstate highway in Maryland where the speed limit is 55mph, the vehicle speeds were measured with electronic devices hidden in the pavement (disregarding large trucks over 20 ft long). During some time periods, police radar was set up at the measurement location. Construct a 95% confidence interval for the effect of radar, as measured by the difference in proportions of vehicles going over 65mph.
The resulting confidence interval is approximately (0.102, 0.138). With 95% confidence, we estimate the proportion of cars going over 65 mph is between 10.2% and 13.8% higher when no radar is present compared to when radar is present. If we wanted to prove that the presence of radar reduces the number of speeders, we would want the difference between no radar (p1) and radar (p2) to be high. Using this information, any difference in the two proportions that fell above this interval could be considered significant evidence that radars do reduce the number of speeders.
Section 13.2B: Significance Testing with 2 Sample Proportions With a confidence interval of two samples were are trying to estimate the difference between two distinct proportions, making no assumptions about the how the two proportions are related. Significance testing helps us see if the effect we see in the samples is really there in the population. The null hypothesis is always that there is no difference in the two populations (p1 – p2 = 0 or p1 = p2) and the alternative displays the difference we suspect is occurring.
Because we are making the hypothesis that p1 = p2, this causes the standard error to be calculated differently using a combined sample proportion . Combined numbers of “successes” Combined sample size Standard Error would then be calculated at follows:
SRS: The 2 samples can be viewed as SRS’s from their respective populations or are the 2 groups in a randomized experiment. Normality: Independence: The two samples are independent. (N ≥ 10nfor each sample) Test Statistic:
Example: Do drivers reduce excessive speed when they encounter police radar? On a rural interstate highway in Maryland where the speed limit is 55mph, the vehicle speeds were measured with electronic devices hidden in the pavement (disregarding large trucks over 20 ft long). During some time periods, police radar was set up at the measurement location.