Download
1 / 32
320 likes | 325 Views
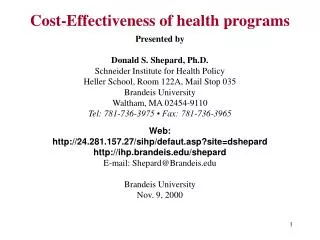
Cost Effectiveness Analysis (CEA) and its Role in the US Healthcare System. Presented by Kenice Frank Advised by Peter Neumann, Sc.D in completion of the Harvard Health Policy Summer Program. INTRODUCTION. Harvard Center for Risk Analysis (HCRA).

E N D
Cost Effectiveness Analysis (CEA) and its Role in the US Healthcare System Presented by Kenice Frank Advised by Peter Neumann, Sc.D in completion of the Harvard Health Policy Summer Program
Harvard Center for Risk Analysis (HCRA) • The Cost Effectiveness Analysis (CEA) Registry provides public electronic access to a comprehensive database of cost-effectiveness ratios. Its goals are to find opportunities for targeting resources to save lives and improve health and to move towards standardization of cost-effectiveness methodology in the field.
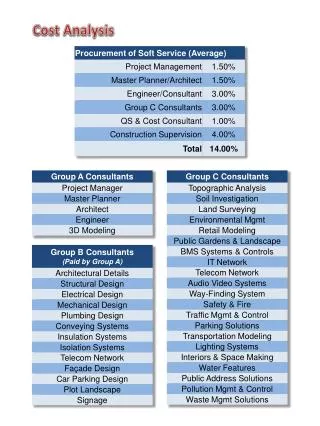
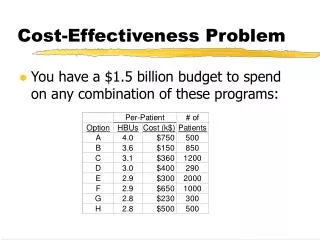
Specific Objectives: • Create a comprehensive database of CUAs • Catalogue the methods used and examine whether studies have been improving • Construct a league table of cost/QALY ratios that adhere to Panel recommendations • Expand the above to include CEAs that report outcomes in terms of cost per life year gained (LY) PHS 398/2590 ( Rev. 05/01)
Importance of the CEA Registry • Is the quality of reporting in published CUAs improving? • Are pharmaceuticals cost-effective? • Are studies adhering to recommended protocols? • Which cancer prevention and treatment interventions are most cost-effective?
Definitions • Cost Utility Analysis (CUA) -a form of economic analysis used to guide procurement decisions, especially health technology assessment (HTA) - cost is measured in monetary units; the item being considered needs to be expressed in a quantitative form • Sensitivity Analysis (SA) -aims to ascertain how the model depends upon the information fed into it, upon its structure and upon the framing assumptions made to build it. http://en.wikipedia.org/wiki/Cost-utility_analysis
Definitions • Incremental Analysis – a method used to analyze the difference between the intervention and the alternative treatments • Discounting – a method used to adjust future costs and benefits to their market value; people prefer things now instead of later http://en.wikipedia.org/wiki/Cost-utility_analysis
What is CEA? • CEA is a systematic method of comparing two or more alternative programs by measuring the costs and consequences of each. • The health outcomes of all the programs to be compared must be measured in the same common units • Cost Utility Analysis (CUA) -a form of economic analysis used to guide procurement decisions, especially health technology assessment (HTA) - cost is measured in monetary units; the item being considered needs to be expressed in a quantitative form • Sensitivity Analysis (SA) -aims to ascertain how the model depends upon the information fed into it, upon its structure and upon the framing assumptions made to build it. Berger et al., 2003
Limitations • The life expectancy alone does not take into account the quality of additional time that is gained This is why we use QALYs
QALYs • QALY = Quality Adjusted Life Year • Advantages: 1. Capture gains from prolongation and improved quality of life in a single measure 2. Incorporate the value or preferences people place on different outcomes Drummond et al., 1997
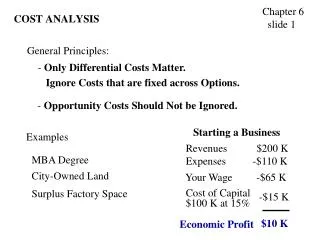
The Impact of a Technology on Costs and Health Intervention is less effective and more costly Increases costs $100,000/QALY $20,000/QALY Increase in QALYS Decrease in QALYS Intervention is more effective and less costly Decreases costs $ Laupacis A. et al., Can Med Assoc J 1992;146:475
Why CEA? • Despite the United States’ resistance to CEA, it has still emerged as the recommended technique for conducting economic evaluation of health and medical interventions • CEA’s rising popularity can be easily noticed by the rising numbers of CEA publications being made in mainstream medical journals.
Why CEA? • The mere presence of this type of increase indicates a system that is in need of CEA’s services. Figure 1: Growth in Published Cost-Utility Analyses, 1976-2001 Source: CUA Registry, Harvard School of Public Health, as ofFebruary 2003.
Phase III Data Collection • Screening Out • Readers fill out a Methods, Ratios and Weights form for each article to extract the data that will go into the database
Phase III Data CollectionMethods Form • intervention types • prevention stage • primary affiliation of author(s) • study sponsorship/funding • perspective • discounting • form completion • cost measurements • reporting of results • sensitivity analysis • discussion section
Phase III Data CollectionRatios Form • target population • intervention • comparator $/QALY from article • population size • impact in $ • ratio uncertainty • direct medical costs • non-health care costs • $/QALY • intervention comparator
Phase III Data CollectionPreference Weights Form • secondary data usage • population sample • sample size • elicitation method(s) • health state • weight range • total # of weights
Cost-Utility Analyses Of Pharmaceuticals Published, Phase II (1998-2001) Updated by Kenice Frank using Phase II data
Interventions Type Frequencies Updated by Kenice Frank using Phase II data
Average acceptable median CE ratio is $50,000/QALY • incremental cost of more than $50,000/QALY gained = rejected • incremental cost of less than or equal to $50,000/QALY gained = accepted Updated by Kenice Frank, using Phase 2 information
References • Neumann, P. J. (2005). using cost-effectiveness analysis to improve health care. New York, Oxford Press. • ISPOR (2003). Health care, cost, quality and outcomes. Lawrenceville, ISPOR. • Neumann, P. J., E. A. Sandberg, et al. (2000). "Are Pharmaceuticals Cost-Effective? A Review of the Evidence." Health Affairs19(2). • Neumann, P. J. (2002). "The Quality and Usefulness of Pharmacoeconomic Studies for Drug Coverage Decisions." Pharmaceutical News9(1): 15-20. • Neumann, P. J. (2004). "Why Don't Americans Use Cost-Effectiveness Analysis." The American Journal of Managed Care10(5): 308-312.
Acknowledgements HCRA • Peter Neumann, Sc.D. • Jenny Palmer, M.S. • James Fraumeni, A.B. • Joshua Cohen, Ph.D. • Adi Eldar-Lissai, MBA • HMS • Joan Reede, M.D., M.PH, M.S. • Binta Beard, M.S. • Xue Fen Su, M.S. • Jo Cole AND National Library of Medicine
Thank You!! Enjoy the rest of the presentations!