Download

1 / 33
330 likes | 334 Views
Study design and sampling (and more on ANOVA) . Tron Anders Moger 8.10.2006. More on ANOVA. Last time: A bit difficult to understand what the goal of ANOVA really is Today: Back to basics, illustrations from agriculture ANOVA was initially constructed for agricultural sciences.

E N D
Study design and sampling(and more on ANOVA) Tron Anders Moger 8.10.2006
More on ANOVA • Last time: A bit difficult to understand what the goal of ANOVA really is • Today: Back to basics, illustrations from agriculture • ANOVA was initially constructed for agricultural sciences
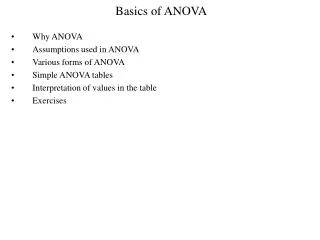
Recall: Could put data in a table as this: • Each type of test was given three times for each type of subject
Testing different types of wheat in a field Interested in finding out if different types of wheat yields different crops Outcome: E.g. wheat in pounds Your field resembles an ANOVA data matrix! One-way ANOVA: Testing if mean crop per 1000 sq. feet is different for different types of wheat!
More complex designs: • Want to test different fertilizers also Do different wheat types give different crops? Do different fertilizers give different crops? Two-way ANOVA! Do e.g fertilizer 1 work better for wheat 1 than for wheat 2 and 3? Is there interaction between wheat and fertilizer? Two-way ANOVA with interaction!
Groups and blocks • In the example: Arbitrary if we put wheat type in group or block • Equally interested in wheat and fertilizer effects in the example • Another example: Want to test 3 different treatments for pigs • Only interested in treatment effect (Group) • Design a study for one-way ANOVA, everyone’s happy
Are we happy? • Is a pig a pig no matter what? • Different species of pigs could give different treatment effects (this is serious for pharma companies) • If we do one-way ANOVA, we won’t find out! • Specifically, if we sample pigs at random, might end up with 5 pigs of the species that responds badly, and 50 pigs of the other species • Results for the 5 pigs will drown in the results for the other pigs, so we won’t even suspect that something is wrong • Blocking variable: Ensure that you sample e.g 30 pigs from each species
Pigs: Two-way ANOVA • Still only really interested in the treatment effect • But, would like to control for the confounding effect of species of pig • Model for one-way ANOVA: Xij=µ+Gi+εij • µ is total mean, Gi is group effect, εij is N(0,σ2) • σ2 includes variation due to all confounders, including species of pig • Only effect we describe in the model, is the treatment effect
Pigs: Two-way ANOVA cont’d • Two-way ANOVA model: Xijl=µ+Gi+Bj+Iij+εijl • Describe both treatment effect (Gi), pig effect (Bi) and interaction (Iij) • Remove variation due to pigs from σ2 (and from it’s primary estimator, MSE) • Means that σ2two-way<σ2one-way • Recall: Test for treatment effect (Gi =0), compares MSG to MSE (MSG/MSE~F-dist), reject if sufficiently large • Similar tests for the other effects, but based on MSB and MSI
Pigs: Two-way ANOVA cont’d • If there is a treatment effect, MSG will be a biased estimator for σ2 • If there is a block effect, denominator MSE will be smaller here than MSW for one-way ANOVA • Value of test statistic will be larger! • Easier to get significant effects! (More power) • Also get more correct estimates for the group means (because of the sampling) • Similar to regression: The more significant variables you include in your model, the greater R2 becomes, and you get more correct estimates for the regression coefficients • R2 increases because σ2 decreases the more variables you include
ANOVA and linear regression • Regression: Split the distance from each data point to the total mean into: • 1. Distance from mean to regression line • 2. Distance from regression line to data point • Got sums of squares SSR (1.), SSE (2.) and SST • Used for estimation and measuring how close data points were to regression line (R2) • However; also used for an F-test on whether all Bi=0 (From slide of detailed explanations of SPSS output) • This is ANOVA in linear regression!
Design differences: ANOVA and regression • Wheat example, additional confounders: Earth quality or amount of sun could vary across the field • ANOVA: Control for this by using a field where they don’t vary, or, repeat study until all types of wheat have been grown in each part of the field • Regression: Collect information on earth quality and sun amounts, and include in the model
Designing a study: • Ideally, should know in advance: • The basic hypotheses you want to test • What information you need in order to test the hypotheses • Which population do you want the results to apply for? • How to collect that information; sampling, design • If regression: What important confounders do you need information on
Sampling in practice • Newbold mentions: • Information required? Has the study been done before? Is it possible to get the information • Relevant population? • Sample selection? Random? Systematic? Stratified? • Obtaining information? Interviews? Questionnaires? • Inferences from sample? Which methods? • Conclusions? How to present your results? • Nonsampling errors; Missing data, dishonest or inaccurate answers, low reliability or validity
Reliability and validity • Validity of a research instrument: The degree to which it measures what you are interesting in measuring • Reliability of a research instrument: The extent that repeated measurements under constant conditions will give the same result • A research instrument may be reliable, but not valid
Types of sampling • Simple random sampling: Select subjects at random • Every subject in the population has same probability of being sampled • Ex: One-way analysis of pigs • If large enough sample, gives you a representative sample compared to the population • Problem: If small sample, will give to few data on interesting sub-groups • Systematic sampling: As random sampling, but you include e.g every 5th subject in your sample
Types of sampling cont’d: • Stratified sampling: Want to ensure that interesting sub-groups of the population are sampled in sufficient numbers (over-sampled) • Divide the population into K strata, randomly sample ni from each stratum • Ex: Pigs, two-way ANOVA • Problems: How many pigs in each stratum? • Cluster sampling: Similar to stratified sampling, but considers geographical units • Divide the population into M clusters, randomly sample m of them • Include all subjects in the sampled clusters
Types of sampling cont’d: • Two-phase sampling: Carry out an initial pilot study, where only a small sample is collected • Then proceed with collecting the main sample • Advantages: Get initial estimates on effects • Initial estimates on variance in data-> sample size, how much data do you need to reject H0? • Disadvantages: Costly, time-consuming • NOTE: Most methods I’ve mentioned requires adjusted formulas for estimation, described in the book
Some study types • Observational studies • Cross-sectional studies • Cohort studies • Longitudinal studies • Panel data • Case / control studies • Experimental studies • Randomized, controlled experiments (blind, double-blind) • Interventions
Cross-sectional studies • Examines a sample of persons, at a single timepoint • Time effects rely on memory of respondents • Good for estimating prevalence • Difficult for rare diseases • Response rate bias
Cohort studies and longitudinal studies • A sample (cohort) is followed over some time period. • If queried at specific timepoints: Longitudinal study • Gives better information about causal effects, as report of events is not based on memory • Requires that a substantial group developes disease, and that substantial groups differ with respect to risk factors • Problem: Long time perspective
Panel data • Data collected for the same sample, at repeated time points • Corresponds to longitudinal epidemiological studies • A combination of cross-sectional data and time series data • Increasingly popular study type
Case – control studies • Starts with a set of sick individuals (cases), and adds a set of controls, for comparison • Retrospective study – Start with finding cases and controls, then dig into their past and find out what made them cases and controls • Cases and controls should be from same populations • Matching controls • Cheap, good method for rare diseases • Problem: Bias from selection, recall bias
Epidemiology • Epidemiology is the study of diseases in a population • prevalence • incidence, mortality • survival • Goals • describe occurrence and distribution • search for causes • determine effects in experiments
Measures of risk in epidemiology • Relative risk (used for prospective studies) • Odds ratio (used for retrospective studies)
Op-nurses cont’d: • Relative risk: Proportion of abortions among op.nurses divided by proportion of abortions among others RR= =3.1 • Odds ratio: Odds for abortion among op.nurses: 10/26 Odds for abortion among other nurses: 3/31 • Gives the odds ratio: OR: =4.0
Correcting for finite population in estimations • Our estimates of for example population variances, population proportions, etc. assumed an ”infinite” population • When the population size N is comparable to the sample size n, a correction factor is necessary. • Used if n>0.05N • Examples: • Variance of population mean estimate: • Variance of population proportion estimate:
Determining sample size • An important part of experimental planning • The answer will generally depend on the parameters you want to estimate in the first place, so only a rough estimate is possible • However, a rough estimate may sometimes be very important to do • A pilot study may be very helpful
Sample size for means (large samples) • We want to estimate mean • We want a confidence interval to extend a distance a from the estimate • We guess at the population variance • A sample size estimate: • Small samples: If we have a population of size N, and want a specified , we get at 95% confidence level
Example: Have dental costs increased since 1995? • Want to compare dental costs in 1995 (adjusted to 2006-kroner) and 2006 • Could do a paired sample t-test. How many individuals do we need to ask? • We believe a difference of 1500 kroner is important • From experience, we think for the difference is 2500 kroner • Need 4*25002/15002=at least 12 individuals to find a significant difference if our assumptions are correct
Sample size for proportions (large samples) • We want to estimate proportion P • We want a confidence interval to extend a distance a from the estimate • Recall: CI for P=P+Zα/2√P(1-P)/n • A sample size estimate: • Largest possible value of this expression is 1/a2 (P=0.5) at 95% confidence level
Example: Poll • Want to estimate the proportion voting Labour with 95% confidence interval extending +3% • Need to include at most 1/0.032=1112 people in our study • Would probably stick with 1112 if we don’t have any reason to believe P is smaller than 0.5
Next time: • Some more on time-series analysis from chapter 19 • Presentation of results: How do you do it? • Recap of the different methods we’ve learnt