Download
1 / 10
100 likes | 263 Views
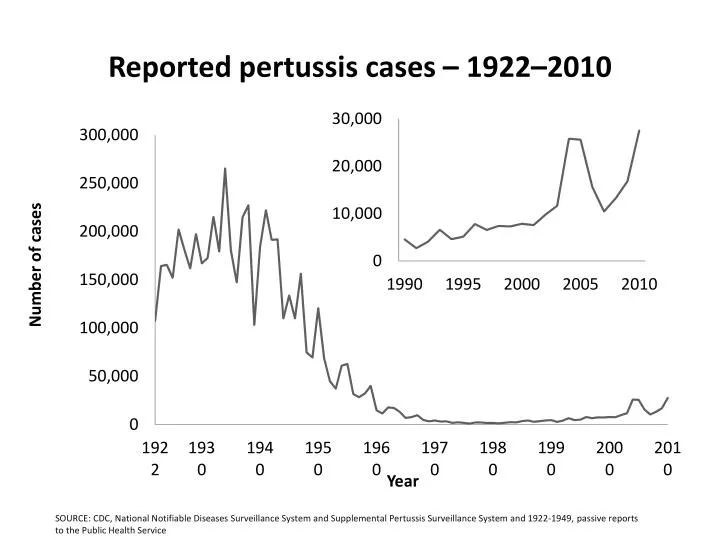
DTaP. Tdap. DTP. Reported pertussis cases – 1922–2010. SOURCE : CDC, National Notifiable Diseases Surveillance System and Supplemental Pertussis Surveillance System and 1922-1949, passive reports to the Public Health Service . Pertussis Immunization in the US. 1940s

E N D
DTaP Tdap DTP Reported pertussis cases – 1922–2010 SOURCE: CDC, National Notifiable Diseases Surveillance System and Supplemental Pertussis Surveillance System and 1922-1949, passive reports to the Public Health Service
Pertussis Immunization in the US • 1940s • whole cell pertussis vaccine (DTP) • 1992 • acellular pertussis vaccine (DTaP) for 4th and 5th • given at 15-18 months and 4-6 years • 1997 • DTaP for all 5 doses • including priming doses at 2, 4 and 6 months • 2005 • adolescent and adult acellular vaccine (Tdap)
Tdap Vaccine Effectiveness • Australia – screening method • 78% • MN case-control study • 72% • St. Croix outbreak • 66% • Maine school-based outbreaks • 69%
Annual incidence by State, 2010 2010 incidence 9.0 (n=27,550) Incidence 1.1-3.6 3.7-6.5 6.6-10.2 10.3-23.2 Incidence is per 100,000 population Source : CDC National Notifiable Disease Surveillance System, *2010 data accessed July 22, 2011 CDC Wonder Population Estimates (Vintage 2009)
Annual incidence by State, 2011* 2011 incidence 5.0 (n=15,216) Incidence 0.4-2.0 2.1-4.5 4.6-7.7 7.8-15.2 *2011 data are provisional. Incidence is per 100,000 population Source : CDC National Notifiable Disease Surveillance System, 2011 CDC Wonder Population Estimates (Vintage 2009)
Reported Pertussis Incidence by Age Group — 1990–2010 SOURCE: CDC, National Notifiable Diseases Surveillance System and Supplemental Pertussis Surveillance System
California Epidemic Study • Cases and controls 4 through 10 years of age at illness onset or enrollment from 15 CA counties • Unmatched controls ratio of 3 to 1 obtained from case-patient providers • Vaccine histories collected by in-person visits to providers • Logistic regression used to estimate odds ratio
California Vaccine Effectiveness (VE) Study Findings • Overall VE was 88.7% • VE waned with time • 98% VE during the first year following the 5th dose • each year out resulted in a modest decrease in VE • by 5 or more years from 5th dose, VE had fallen to 71%
Summary and Conclusions • Excellent initial DTaP vaccine effectiveness • followed by modest waning of immunity each year • Pertussis burden in children younger than 10 years appears to be a “cohort effect” from change to all acellular vaccines • i.e. a problem of susceptibility despite vaccination • Pertussis continues to be a public health problem, despite well-implemented vaccination program