Download
1 / 23
240 likes | 395 Views
Simplified Data Driven Methods for FTA Small Starts Project Evaluation. Jeffrey Roux (AECOM ) Prasad Pulaguntla (AECOM). May 8 , 2013. Agenda. Richmond Broad Street BRT Project Overview The Challenge Approach Bump on the Road Project extensions Lessons Learned

E N D
Simplified Data Driven Methods for FTA Small Starts Project Evaluation Jeffrey Roux (AECOM) Prasad Pulaguntla (AECOM) May 8, 2013
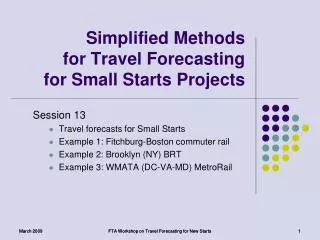
SERPM 6.7 Development Agenda • Richmond Broad Street BRT Project Overview • The Challenge • Approach • Bump on the Road • Project extensions • Lessons Learned • Acknowledge MANY contributions to the study
Broad Street Corridor • Broad Street is THE bus corridor in Richmond, VA with 17,000 daily transit trips. • Broad Street serves as main GRTC artery in Downtown • Today: bus bunching, sub-standard lanes and accidents result in a relatively slow and unreliable journey. • Full BRT saves up to 3 min. on local bus trips and 6 min. on BRT/express bus trips
Problem Statement • Existing conditions • 48 buses/direction/peak hour within downtown RIC • Current service is “local” stopping every block • Narrow Parking lane (8’) dedicated to buses in peak-period (with poor enforcement) • Problems • High bus volumes with multiple routes entering the trunk line lead to bus bunching and low reliability • Existing narrow downtown bus lanes cause conflicts and accidents • Conga-line conditions leads to very slow travel times
Goals and Objectives • Provide more attractive transit service • Improve travel times • Reduce accidents • Improve customer experience/amenities • Improve system efficiency • Improve reliability • Improve convenience, efficiency of transfers • Expand market
Project Tactics • BRT trunk line to provide a higher quality transit service: • Higher quality, low floor, branded vehicles • Formal BRT transit stops • Formal branded shelters • Off-board fare collection • Dedicated bus lanes for half of corridor to speed trips • Traffic signal priority • Trunk line BRT is 6 min faster to Downtown (vs. express bus without priority treatments) and 14 min faster compared to local bus. • Consolidated bus stops in Downtown for ALL buses • Downtown operations consolidate to three stops • Multi-platform boarding • Local buses are 3 min. faster through Downtown
The Challenge • Prepare patronage forecast & FTA Project Justification materials for Small Starts application • Off the shelf tools (in 2010): • VDOT Richmond/Tri-Cities Forecasting Model (RTFM): • Highway focused forecasting model • Very good representations of highway travel speeds • Basic transit network and limited mode choice capabilities • Fall 2009 GRTC On-Board Survey • Approach: Develop data-driven approach from RTFM networks and on-board surveys
Data Driven Approach – Two Elements • Transit Networks: • Recoded RTFM Transit Networks (CUBE TP+/TRNBUILD) • Calibrated bus travel times from VDOT peak/off-peak highway travel times (equations of motion) • On-Board Transit Survey – Trip Tables: • VDRPT surveyed GRTC routes in Fall ’09 • Comprehensive picture of GRTC existing markets • Approach: Measure how existing riders (surveyed) impacted by project and estimate new riders through representation of transit network changes
Transit Network Development Recoded RTFM Transit Networks to Reflect Nov. ‘09 Service (survey): • Separate peak/off-peak transit networks: • Peak (7-9 AM) • Off-Peak (10-2 PM) • Correct route routing (including loops through D’town) • Zone splits in project corridor • Properly reflect stop locations • Developed bus speed relationships, using equations of motion based approach: • AM Peak – Congested highway travel times • Off-Peak – Free flow highway travel times
Bus Travel Time Validation Approach: Accurately represent bus travel speeds by pivoting off of RTFM highway speeds Process built “equation of motion” approach to replicate current scheduled travel times of all buses: • Used typical bus acceleration/deceleration rates • Calibrated an average “dwell” times per stop • Process worked very well as virtually all buses are within 15% or (3-4 min.) of scheduled end-to-end running times
2009 GRTC On-Board Survey 4,500 completed surveys representing 32,900 GRTC boardings: • Included VCU and non-VCU bus routes • For approach we processed: • Trip Ends (Productions and Attractions) • Mode of Access (PNR, drop-off and walk) • Time of Day (peak & off-peak) • Converted boardings to linked trips • Conducted on all routes, except inter-city routes: • Petersburg-Downtown Richmond Express • Fredericksburg-Ashland-Downtown Richmond Express • Not material to Project
Development of a Base Year 2009 Transit Trip Table • Developed CUBE/TP+ Survey-Based Trip Table (Fall ‘09) • Stratified by: • Time of Day (Peak and Off-Peak) • Mode of Access: • PNR & Walk • KNR treated like walk (with drop-off location treated as PROD end) • VCU and non-VCU trips stratified • VCU Trips Stratified Separately • Operates under contract to GRTC • Free w/valid student/staff ID • Main to Downtown Campus shuttles & fringe parking • Policy of VCU students on BRT unknown
Calibration of Transit Path Weights • AECOM calibrated TRNBUILD path-building and assignment weights through iterative assignment of transit trip table • Started with FTA “national experience” weights and tuned • Final weights used were: • IVTT Weight = 1.0 • Waiting/Transfer Waiting Time Weight = 1.5 • Walk Time Weight = 2.0 • Drive Time Weight = 2.0 • Transfer penalty = 6.0 min per transfer • Walk speed = 3 mph
Developing Project Forecast/FTA Justification Materials • 2009 demand grown to represent 2015 no-build using MPO estimates of POP growth • Development of CUBE/TP+ process where calibrated path-weight parameters are multiplied to create an equivalent IVTT “transit impedance” score for each I-J pair • Alternative specific effects for BRT built into the transit impedence • 5% discount for BRT IVTT • 5 min. “constant effect” for BRT only riders, 2 min for BRT & Local Bus Riders • Compare the “transit impedance” between alternative and use an elasticity range of -0.3 (low) to -0.7 (high) to estimate “new” riders through alternative progression (No-Build – TSM Baseline – Build) • Assign the resulting transit trip tables to the network for project ridership forecasts • Compare resulting transit impedance to estimate Transit System User Benefits
Bump in the Road – New PNR Lot Park-and-Ride at Staples Mill (near end of line) • Scale is small (about 100 spaces) • No existing PNR behavior in corridor - PNR’s are in fringe suburban areas feeding express buses to Downtown • Since modest number of spaces, we assumed: • 75% utilized (additional new riders, about 150) • Calculate UB’s by treating these riders as “new” riders (i.e. half the benefit) Not sophisticated, but how far could we be off? Bigger transformation would require more sophisticated approach.
Project Extensions • GRTC used on-board survey data to plan their 2015 bus network • Refinements to transit networks/procedures were embedded in the VDOT Richmond/Tri-Cities Forecasting Model update (2012) • Bus speeds • Network coding • Path/assignment weights • On-Board survey used for RTFM mode choice calibration targets • Comprehensive on-board transit survey allowed us to develop procedures to simulate “non traditional” trips: • Drop-off transit trips to non-formal locations • VCU fringe parking trips
Summary/Wrap-Up • Small Starts project justification requires forecaster to tell the story of the project “who will benefit and why” • Data driven approach is ideal for developing patronage forecasts for incremental transit service improvements: • Routed in real traveler patterns, not models • Transparent & easy to articulate benefits of projects • Easy to describe cause and effect in the forecasts • Forecaster can articulate risk by segmenting: • What is “known” from the survey data (X riders in the corridor who will save at least 5 min. from the project) • What is not “known” (penetration of choice market, given BRT introduction) • FTA was very supportive of approach
Acknowledgements Virginia Department of Rail & Public Transportation – Amy Inman GRTC – Larry Hagin and Scott Clark VDOT – Rick Tambellini, Juyin Chen and Paul Agnello FTA – Jim Ryan, Ken Cervenka, Nazrul Islam AECOM – Jeff Bruggeman Connectics Transportation Group – Jim Baker Michael Baker – Lorna Parkins, Scudder Wagg Parsons Transportation Group – Gibran Hadj-Chikh VHB - Ram Jagannathan Project “Graduates” – Chandra Khare, AbishekKomma, Jeremy Raw, Bill Woodford, Mike Lambert, Frank Spielberg and Sharon Hollis
Thank You! Jeffrey.Roux@aecom.com Prasad.Pulaguntla@aecom.com