Download
1 / 20
200 likes | 306 Views
Teaching the BIG IDEAS of Statistics in the Introductory Course. Christine Franklin University of Georgia Department of Statistics. Teaching: Developing Future Minds. Always Learning as a Teacher. The New Generation of Student. Priorities of Teaching.

E N D
Teaching the BIG IDEAS of Statistics in the Introductory Course Christine Franklin University of Georgia Department of Statistics
Priorities of Teaching • As the professor of the class, constantly demonstrate your passion for the area of statistics and why the content is important in the students’ lives
Priorities of Teaching • Use different pedagogy in the class • Group and discovery work • Help students build friendships within the class and make students accountable to each other
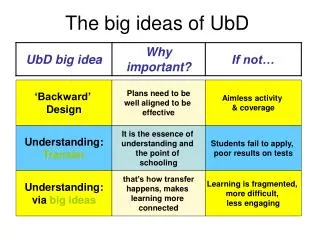
Teaching the Content • Especially for the intro courses, I firmly believe in teaching the BIG PICTURE of the BIG IDEAS and CONCEPTS, not a laundry list of disjointed topics • Teach what you want students to remember 6 months from when they complete the course
A Recent Study • Survey of more than 2300 undergraduates found 45% show no significant improvement in the key measures of critical thinking, complex reasoning and writing by the end of their sophomore years.
Teaching Statistics The big picture of statistical reasoning Communication skills (writing and oral) Critical Thinking Skills When students read a media item, what are the important questions to ask in assessing the statistical content?
Big Picture – Statistical Investigative Process • Statistical question • How to design a study to collect data • Analyze data – this includes exploring the data understanding key concepts like a sampling distribution and P-values and margin of errors • What are appropriate conclusions to make from the study based on the type of study conducted
Discrimination Study • 48 male bank supervisors were each given the same personnel file and asked to judge whether the person should be promoted to a branch manager job that was described as “routine’ or whether the person’s file should be held and other applicants interviewed. The files were identical except that half of the supervisors had files showing the person was male while the other half had files showing the person was female. Of the 48 files reviewed, 35 were promoted.
Preliminary Questions • What is the statistical question? • What type of study design was used by the researchers? Experiment or observational study? • Ideally, how should the researcher distribute the files? What is the role of randomization?
Preliminary Questions • If no discrimination, expected number of males out of 35 promoted? Expected number of females? • What do you believe would provide strong evidence of discrimination against women? How many males promoted? • What if evidence falls into a ‘gray area’- not clearly obvious? How many males promoted? • Results of actual study: 21 males promoted – the gray area
Simulate the study using the assumption of a random model • Use a deck of 48 cards – the 24 black cards are males, 24 red cards are females • Shuffle the deck well and deal out 35 cards. Count the number of black cards out of 35. Record the summary statistic for thus simulated study. • Repeat the process above 19 more times. • Create a dotplot of the 20 summary statistics (counts).
Using Simulated Sampling Distribution • Create a simulated class sampling distribution with close to 1000 simulated counts. • Explore using descriptive statistics – graphs and numerical summaries • Discuss what is the null and alternative hypothesis • Find a simulated P-value • Talk about statistical significance • Discuss Type I and II error and potential consequences
Re-enforce the Big Ideas • Define your Big Ideas for the course and teach these concepts as a unified content throughout the course not as disjointed topics • Never let the student lose sight of the Statistical Investigative Process as you throughout the course add new tools to the student’s tool box