Download
1 / 1
10 likes | 165 Views
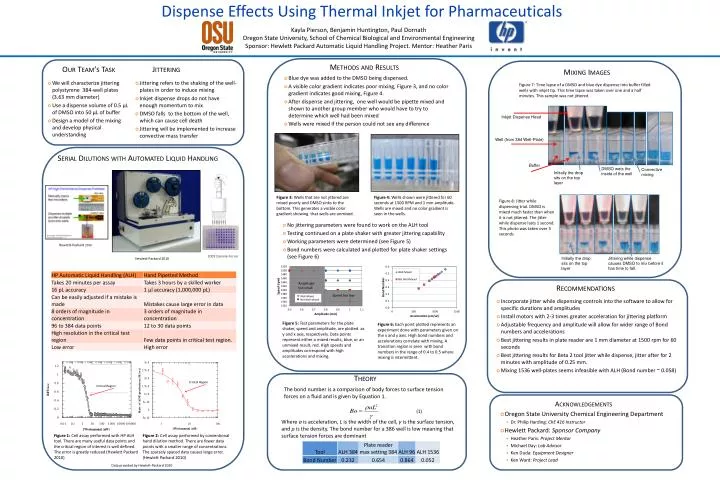
Figure 7: Time lapse of a DMSO and blue dye dispense into buffer filled wells with inkjet tip. This time lapse was taken over one and a half minutes. This sample was not jittered. Dispense Effects Using Thermal Inkjet for Pharmaceuticals. Inkjet Dispense Head.

E N D
Figure 7: Time lapse of a DMSO and blue dye dispense into buffer filled wells with inkjet tip. This time lapse was taken over one and a half minutes. This sample was not jittered Dispense Effects Using Thermal Inkjet for Pharmaceuticals Inkjet Dispense Head Kayla Pierson, Benjamin Huntington, Paul Dornath Oregon State University, School of Chemical Biological and Environmental Engineering Sponsor: Hewlett Packard Automatic Liquid Handling Project. Mentor: Heather Paris Well (from 384 Well-Plate) Methods and Results Our Team’s Task Jittering Mixing Images • Blue dye was added to the DMSO being dispensed. • A visible color gradient indicates poor mixing, Figure 3, and no color gradient indicates good mixing, Figure 4. • After dispense and jittering, one well would be pipette mixed and shown to another group member who would have to try to determine which well had been mixed • Wells were mixed if the person could not see any difference • We will characterize jittering polystyrene 384-well plates (3.63 mm diameter) • Use a dispense volume of 0.5 µL of DMSO into 50 µL of buffer • Design a model of the mixing and develop physical understanding • Jittering refers to the shaking of the well-plates in order to induce mixing • Inkjet dispense drops do not have enough momentum to mix • DMSO falls to the bottom of the well, which can cause cell death • Jittering will be implemented to increase convective mass transfer Buffer DMSO wets the inside of the well Convective mixing Initially the drop sits on the top layer Serial Dilutions with Automated Liquid Handling Figure 3: Wells that are not jittered are mixed poorly and DMSO sinks to the bottom. This generates a visible color gradient showing that wells are unmixed. Figure 4: Wells shown were jittered for 60 seconds at 1500 RPM and 1 mm amplitude. Wells are mixed and no color gradient is seen in the wells. Figure 8: Jitter while dispensing trial. DMSO is mixed much faster than when it is not jittered. The jitter while dispense lasts 1 second. This photo was taken over 5 seconds • No jittering parameters were found to work on the ALH tool • Testing continued on a plate shaker with greater jittering capability • Working parameters were determined (see Figure 5) • Bond numbers were calculated and plotted for plate shaker settings (see Figure 6) Hewlett-Packard 2010 2009 Daniele Focosi Initially the drop sits on the top layer Jittering while dispense causes DMSO to mix before it has time to fall. Hewlett-Packard 2010 Amplitude too small Speed too low Well-Mixed Not Well-Mixed Figure 5: Test parameters for the plate shaker, speed and amplitude, are plotted as y and x axis, respectively. Data points represent either a mixed results, blue, or an unmixed result, red. High speeds and amplitudes correspond with high accelerations and mixing. Figure 6: Each point plotted represents an experiment done with parameters given on the x and y axis. High bond numbers and accelerations correlate with mixing. A transition region is seen with bond numbers in the range of 0.4 to 0.5 where mixing is intermittent. Recommendations Theory Critical Region Critical Region • Incorporate jitter while dispensing controls into the software to allow for specific durations and amplitudes • Install motors with 2-3 times greater acceleration for jittering platform • Adjustable frequency and amplitude will allow for wider range of Bond numbers and accelerations • Best jittering results in plate reader are 1 mm diameter at 1500 rpm for 60 seconds • Best jittering results for Beta 2 tool jitter while dispense, jitter after for 2 minutes with amplitude of 0.25 mm. • Mixing 1536 well-plates seems infeasible with ALH (Bond number ~ 0.058) The bond number is a comparison of body forces to surface tension forces on a fluid and is given by Equation 1. • Acknowledgements • Oregon State University Chemical Engineering Department • Dr. Philip Harding: ChE 416 Instructor • Hewlett Packard: Sponsor Company • Heather Paris: Project Mentor • Michael Day: Lab Advisor • Ken Duda: Equipment Designer • Ken Ward: Project Lead (1) Where a is acceleration, L is the width of the cell, γ is the surface tension, and ρ is the density. The bond number for a 386 well is low meaning that surface tension forces are dominant Figure 1: Cell assay performed with HP ALH tool. There are many useful data points and the critical region of interest is well defined. The error is greatly reduced (Hewlett Packard 2010) Figure 2: Cell assay performed by conventional hand dilution method. There are fewer data points with a smaller range of concentrations. The sparsely spaced data causes large error. (Hewlett Packard 2010) Data provided by Hewlett-Packard 2010