Download
1 / 38
380 likes | 530 Views
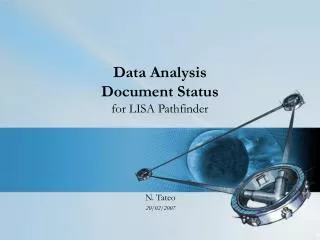
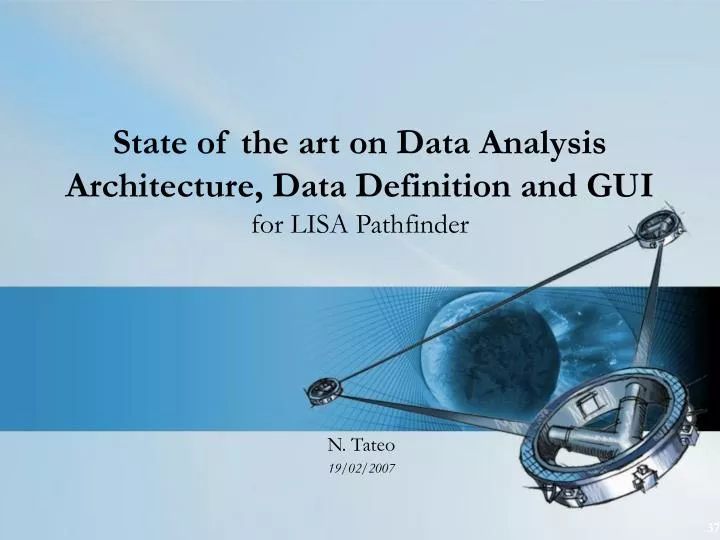
State of the art on Data Analysis Architecture, Data Definition and GUI for LISA Pathfinder. N. Tateo 19/02/2007. Mission Control Mission Planning Flight Dynamics On-Board Software Simulator. Satellite ~. Mission Operations Centre (MOC). Data Distribution System (DDS). MUST. ESOC.

E N D
State of the art on Data AnalysisArchitecture, Data Definition and GUIfor LISA Pathfinder N. Tateo 19/02/2007
Mission Control • Mission Planning • Flight Dynamics • On-Board Software • Simulator Satellite ~ Mission OperationsCentre (MOC) Data DistributionSystem (DDS) MUST ESOC ESAC BackupServer RemoteServers(Trento, Hannover…) • Payload Scheduling • Quick-look Analysis • Web STOCData Server Science & TechnologyOperations Centre(STOC) Data Analysis Architecture
MUST Client STOCData Server MUST TDRS Data Retrieval The LTP PIs Team responsibility begins at the STOC. The MUST converts the data to ASCIIand saves them in the Repository. • A MUST client should be automaticallyimplemented into the STOC software. • Among traditional data retrieval system (TDRS), the MUSTis quicker and more efficient but it’s not an operational tool.Who’s going to be responsible for it?
Data handling in STOC DataArchive ASCIIRaw Data ASCIISatellite Data MATLAB GUI Analysis Objects User GUI Parameters Output Analysis Objects ResultsArchive
Analysis requisites The analysis has 2 fundamental requisites: • Traceability;every result must provide all the parameters and instructions used in its reckoning. • Reproducibility;every result must be recomputable in any moment. These requisites are not necessarily bonded.
Traceability Traceability requires the complete setof fundamental parameters and instructions used to reckon the result. Too many for the plot caption • Plot parameters, included in the plot caption • Global parameters, someway provided attached to the given result. This is a separation we got to do anyway
GUI parameters How to distinguish between plot and global parameters? The plot parameters are necessary to understand the result, so they must be included in the plot caption. • Analysis title • Original data analyzed (channels, time, …) • Basic preprocessing data (windowing, resampling, …) The global parameters include every setting of the GUI. • Analysis performed (algorithm version, local parameters, …) • Preprocessing details • Extensive plot parameters
Reproducibility Assuming that every user has direct access to raw dataand the licensed DA Package,to ensure reproducibility we have to providethe entire processing history, i.e.: • Definition of the analyzed data. • Parameters used and analysis model to set the GUI. • Details of all the algorithms applied.
Output The typical outputs are: • Analysis Diagram, containing the entire sketchof the performed procedure (for example,the .MDL Simulink Model file). • The index file, containing all the GUI parameters and the history of analyzed data. • The numerical results. Output Analysis Diagram Parameters Results
Saving output Best option is to save these data into the Analysis Object,i.e. to enclose parameters and results togetherin a wrapper, thus ensuring optimal shareability. The GUI will be able to read the AOto automatically import all the given settings. The DA Package will include an export tool able toread the AO (containing results, parametersand the analysis model) to produce plotsor to export them into readable format (ASCII).
STOC scheme AOWrapper DataArchive ASCIIRaw Data ASCIISatellite Data MATLAB GUI Analysis Objects Analysis Diagram GUI Parameters Parameters Analysis Objects Results ResultsArchive
Data Definition To define the list of (science) channelsavailable for data analysis,is necessary to introducethe system architecture.
On-Board Architecture OBC External BUS LTP Internal BUS
LTP Internal Architecture(DMU ↔ LTP Units) Internal BUS
LTP External Architecture(DMU&IS FEE ↔ OBC) OBC Power Antennas LTP Gyros FEEP External BUS
Signal flow 1. Interferometer 10 channels (+1 status flags) ~ 2. Inertial Sensors 12 channels 3. Thermometers 24 channels 4. Magnetometers 4x3 channels 5. Radiation Monitor 1 channel
The Graphic User Interface In the optimization design processthere are 4 features to consider. The GUI must be • Simple • Fast • Powerful • Flexible An interface failing these features will likely beput aside and not used, substituted by personal scripts.
The traditional approach The traditional GUI gathers fixed functions in a single window; this approach it’s hardly flexibleand precludes complex analyses.
Visual approach Visiquest Many recent softwares offer a visual approach, which let the user to compile every analysis just linking predefined blocks, each recalling an analysis function. Examples areVisiquest…
Visual approach Triana …and Triana.
A popular GUI The best proof of efficacy, flexibility and simplicityof this kind of GUI is the LEGO Mindstorm application:built in LabView to let every user,from children to professors in robotics,to program a robot to perform even complex tasks.
A popular GUI Labview Mindstorm NXT
The time problem The GUI development must face the lack of time, and shouldn’t require more than the development of analysis functions in the DA package. An approach based on MATLAB Simulinkwould let to begin as soon as possiblethe development of functions,ensuring the ability to implement them intothe Simulink environment later on. It would be very easy to store the analysis model insideeach AO, in a diffused and popular format.
Simulink for Signal Analysis Even if Even if Simulink was born to perform simulation (one data each step, for many simulation steps), it’s a long time since it evolved into a signal analysis capable tool (all data in a single step).
The Simulink GUI Simulink can realize a GUI similar to Visiquest or Triana, providing the ability to plan and execute complex analyses.
In the lower part, the GUI Control Panel.For every block selected above, in this partwill be possible to set the corresponding parameters. On top, the blank window to sketch the analysis diagram.Blocks can be dragged, dropped and linked easily. GUI Scheme On the left, a blockset librarywith all the licensed and distributedanalysis functions, ready to bedragged into the diagram. BlocksLibrary Simulink Analysis Diagram GUI Control Panel
Simple A complete data analysis can be setwith just a few clicks. Blocks can be freely dragged from the library into the analysis diagram. The visual connection among blocks makes easier to understand and plan the analysis.
Quick A first glance provides most of the information about the analysis.A single click may execute an entire preformatted calculation. An entire analysis diagram can be stored into a block, ready to be used at any time. The Simulink analysis is as fast as the common Matlab reckoning.
Powerful There’s no limit to the complexity of the analysis which can be carried out. Using different blockseach holding an entire different procedure,the user has the ability to perform multiple calculation at once.
Flexible A previous analysis can be reloaded and modifiedat any moment. Since the diagram ofthe analysis is storedwith all the results and parameters, just a few clicks are necessary to modify and execute again every calculation.
Simulink would let to invest most of the timeon the actual programming of analysis algorithms,which could be implemented in a second time(by a wrapper, to make them able to deal with AO) directly into the GUI. Simulink approach Wrapper Wrapper Wrapper Wrapper Resampling Detrending Windowing Spectra Input Output
Advantages: Simulink pros & cons • Would let to begin the programming development immediately, postponing the implementation of functions into the GUI. • Requires by far less time and expertise to build a complex GUI, with respect to new ad-hoc software. • Offers a widespread and popular development environment, with all the advantages of MATLAB computing. Disadvantages: • Possibly difficult to implement AO into the traditional Simulink model approach. • Requires extra licenses, in addition to basic MATLAB ones.
The basic analysis scheme: Modules Generatortool Server (TCP/IP) Input Selection Input Retrieval Preprocessing Local file (import) Analysis &Postprocessing Data output Data display
Modules Input Selection Modules • Channel info • Channel list • Available times • Data + info • Object id • Processing history • Data lenght • Object manipulation
Modules Output Selection Modules (Text) • ASCII Text • Analysis Object Export • XML, HDF (Graph output) • X-Y • Stair • Colormap • Subplots
Modules • Log spectra (lpsd) • TF/CSD • Spectrogram • Cross-coherence • Cross-correlation • Covariance Matrix • Noise projection • IIR filtering • Wiener • Linear/Non-linear least square Analysis Algorithms Modules (uni/multivariate) • Re-sample • De-trend • Decimation • Whiten • Data selection • Time-series (averaging,…) • Generator tool • ARMA modelling • Spectra (welch)