Download
1 / 31
310 likes | 405 Views
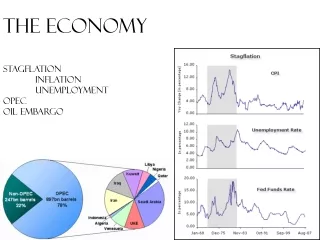
The Economy. Robust Growth - 8.9% Inflation - 6% GDP per capita: - US$ 1,852 in 2009 up from US $ 1,290 in 2005 High rate of capital formation – hydropower investments Buoyant revenue growth Debt at Sustainable Levels Structural Change in the Economy.

E N D
Robust Growth - 8.9% • Inflation - 6% • GDP per capita: - US$ 1,852 in 2009 up from US $ 1,290 in 2005 • High rate of capital formation – hydropower investments • Buoyant revenue growth • Debt at Sustainable Levels • Structural Change in the Economy State of The Economy (2005-2010)
IFI’s and External Agencies • Excellent ratings for macroeconomic performance Tenth Plan Targets • Growth Target of 9% within reach • Maintain fiscal deficit <6% of GDP Assessment of Economic Performance
Economic landscape transformed by hydropower • 3,000 MW Hydropower Capacity by 2020 comfortably overachieved • Increasing tourism revenues by 150% achieved (2008) • Increasing horticulture exports by 300% achieved (2007) Economic Milestone Targets of Bhutan Vision 2020
9% Growth up to 2020 • 16.6 annual revenue growth to 2020 Macroeconomic Perspective up to 2020
Bhutan an LDC due to economic vulnerability and weak human assets base • Economic Vulnerability Index (EVI) in 2009 at 52.9% • 24th most economically vulnerable LDC • EVI indicators of population, size, remoteness, export concentration, share of primary sector in economy impact of natural disasters, agricultural and export instability Economic Vulnerability
LDCs by their Economic Vulnerability Index (EVI) CDP Triennial Review 2009
Geographical Constraints • High Development and Trading Costs • MDGs unit cost US$ 354 per capita a year to 2015 • Low Rank of 161 among 183 economies for Trading Across Borders Indicator • Export costs: US$ 1,352 per container • Import costs: US$ 2,665 per container Economic Vulnerability
Natural disasters • Climate Change Impact on Hydropower and Agriculture
Bhutan likely early achiever for several targets • Strong policy & institutional support, commitment & effective integration with national planning framework PROGRESS TOWARDS MDGS
National level progress on MDG Targets often mask significant disparities & gaps at local level • Other Challenges: - Last mile constraints and costs, - Capacity issues, - Women’s empowerment and - Resource needs MAJOR CHALLENGE: MEETING MDGS WITH GREATER EQUITY
Poverty scaled down from 36.3% in 2000 to 31.7% in 2003 and 23.2% in 2007 • Tenth Plan MTR indicates high likelihood of reducing poverty to 15% by 2013 • Reason for successful scaling back of poverty: - Growth, pro-poor expenditures and effective redistributive policies Goal 1: Reduce Extreme Poverty and Hunger
Issues • Relatively weaker growth in sectors important for livelihoods of the poor (Agriculture) • Underdevelopment of the rural economy • Rural Accessibility still a major constraint • Increase in food poverty from 3.8% in 2003 to 5.9% 2007
Multidimensional Poverty Concept highly relevant within the GNH framework • Multidimensional Poverty Index (MPI) calculated on basis of Bhutan specific indicators & appropriate weights • MPI (2010): 25.8% of Bhutanese are deemed to be MPI poor and deprived in at least 4 of 13 indicators Multi-dimensional Poverty in Bhutan
Higher levels of MPI deprivation pertain to: • access to improved sanitation • cooking fuel (wood, charcoal or dung) • schooling 5 yrs (proxy for literacy) • electricity
Relatively Less MPI Deprivation in: • School Enrollment • Drinking Water • Child Mortality • Nutrition • Assets • Livestock • House
Broad Correlation exists with a few notable deviations Income Poverty and MPI across districts
GOAL 2: ACHIEVE UNIVERSAL PRIMARY EDUCATION On Track • 94% Net Primary Enrollment • 93.6% Primary School Completion Rate Concerns: • Out of school children (11,565) • Quality of education • Withdrawal of school feeding programmes
GOAL 3: PROMOTE GENDER EQUALITY AND EMPOWERING WOMEN Complete Gender Parity in Primary and Secondary Education • 102 girls for 100 boys in primary schools • 103.5 girls for 100 boys in secondary schools Concerns: • Gender imbalance at tertiary education (60.8 to 100 and low female literacy levels • Low level of female representation in national parliament (13.8%) and local government (7%)
GOAL 4: REDUCE CHILD MORTALITY • On Track with a 48% reduction in IMR to 47 per 1,000 live births from 91 per 1000 live births • On Track with a 53% reduction in Under-5 MR to 69 per 1,00 live births from 148 per 1000 live births Concerns: While MDGs are on track, Tenth Plan Targets would be highly challenging
GOAL 5: IMPROVE MATERNAL HEALTH • On Track with a 64% reduction in MMR to 200 per 100,000 live births from 560 per 100,000 live births Concerns: Data issues: MMR still high and linked to low birth attendance (65%)
GOAL 6: COMBAT HIV/AIDS, MALARIA AND OTHER DISEASES • Successful rollback of Malaria and TB incidence • HIV/AIDS prevalence low but high risk factors and rising infection trends
Goal 7: Ensure Environmental Sustainability • High forest cover at 70.46% with protected area at 51.3% • On track for CO2 emissions – negative emissions • Pledge to maintain Carbon neutral economy and minimize carbon footprint
Access to Improved Sanitation at 96.4%. Early achiever • Access to Improved Drinking Water Source at 96%. Early achiever.
Goal 8: A Global Partnership for Development Decent Employment • Youth Unemployment still a major concern with about 9.2% unemployment among youths ICT • Teledensity: Fixed line increased from 2.4 telephones to 3.8 per 100 ppl • Mobile subscribers: Increased from 5.96 mobiles to 56.7 per 100 ppl • Internet: Increased from 0.008 to 13.6 per 100 ppl
Resourcing MDGs and Other Development Activities • MDG Needs Assessment and Costing • US$ 1.5 Billion required between 2011-2015 • Rising recurrent expenditures • Recent Mckinsey Study on financing health care in Bhutan reflected that healthcare costs could go up by as much as 70% over next 5 years • ODA Inflows will still continue to be vital Resource Challenges