Download
1 / 38
380 likes | 555 Views
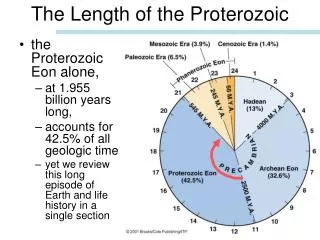
Modelling fish stocks by both age and length: partitioning cohorts into length ‘slices’. Richard McGarvey John E. Feenstra South Australian Research and Development Institute (SARDI). Background.

E N D
Modelling fish stocks by both age and length: partitioning cohorts into length ‘slices’ Richard McGarvey John E. Feenstra South Australian Research and Development Institute (SARDI)
Background • In fishery models, we generally seek to capture the dynamics of fish populations by constructing time-dependent models of those populations and fitting them to all available data. • Most often the principal limitation is in the limited scope of information in the data set. • This is a costly limitation to overcome.
More accurate model formalism • In some cases, however, we can make better use of the information we’ve got. • If we can construct more accurate models of the population, tailored to the specific information we have available, then it is hoped, the accuracy and precision of the estimated outputs can be improved.
Data (I): Catch and Effort Totals • Commercial fisherman are usually required to report the catch of fish, in weight landed, and some measure of the fishing effort used to harvest that catch. • Catch per unit of effort can give information about relative stock abundance. • Fishery models fit to these data by predicting the catch for any given set of estimated parameters and fitting the model, that is, finding the parameters which best agree with data. • Usually we use maximum likelihood (or Bayesian) methods to estimate these parameters.
Data (II): Age samples • The second primary data source is aged fish samples, by otoliths. • Temperate zone fish, subject to yearly seasonality water temperature and thus growth, can often by aged this way. • The terms for fitting to age samples are added to those fitting to catch totals in the same the log likelihood function to estimate quantities of interest to fishery managers.
Fishery Models are Age Based • Many fish models rely principally on these data sources (catch/effort and sampled ages). • Most fishery models these days are age-based, meaning that the model fish population is broken down by the numbers of fish in each age group. • Length-based models are primarily used for invertebrates, where no otolith or other hard body parts are available to age individual animals.
Incorporating Length (Along with Age) • Sometimes, the quality of fishery model estimates, even where age samples are available, can be improved by incorporating length as an additional independent variable. • The idea is to model the spread of lengths dynamically, and account for population number by both age and length. • In this way, the models can be both age- and length-based. • Length is a fundamental quantity used in managing fish populations, esp. by legal minimum length.
Better Use of Available Data • This allows us to make better use of the available fishery data because fishery biologists measure the length of all sampled fish from which otoliths are removed. • In addition, often there are more sampled fish measured for length than are aged by otoliths, because it is so much less work to just measure a fish length than to age it. • For example, with garfish in South Australia, biologists aged about 15% of fish that were sampled, but 100% were measured for length.
Existing Age- and Length-based Methods • These include: • Deriso and Parma (1980) • Von Foerster models (including papers by Banks, Smith, Botsford) • Growth-transition matrices, one for each age (usually applied only for length-based models applied to whole model populations) • ‘Growth groups’ (Punt and Cao).
Why New Methods Needed • However, apart from growth groups, these age- and length-based models are not used much in fishery modelling worldwide because they are either • too mathematically exacting (Von Foerster), • apply for only a fairly specific set of model assumptions (Deriso and Parma), or • are computationally inefficient (growth-transition matrices).
Generally applicable age- and length-based (numerical) methods needed • Nearly all fishery models must be maximised numerically on a computer. • Thus, there is a need for a simpler approach which • can converge on a computer in an hour or two, and • which is generally applicable, i.e. which can extend typical age-based model formulations.
Aim of this talk: Slices • So in this talk we’re proposing a new modelling formulation to do this task. • We call this form of age- and length-based model ‘slice-growth’ because the lengths in each cohort are sliced off in successive model time steps. • One feature which distinguishes this approach from growth-transition matrices is that we allow the widths of each length bin (each slice) to vary. • It, in this way, differs from growth transition matrices which defined fixed, say, 1-cm, length bins for the breakdown of each age group.
Objectives of this slice-based length partition • There are two basic objectives for how slices (length bins) of each age group are constructed: • First, to create one (and exactly one) new length bin for each model time step. • Second, to separate legal-size fish in each age group from ‘sublegals’, that is, to separate fish of lengths above and below the legal minimum length (LML).
Application to King George whiting • The principal underlying basis for the creation of slices is the growth submodel. • In particular, we require a full probability density function describing the spread of fish lengths for each model time step. • A normal likelihood growth model was fitted to 10,800 aged and length-measured fish samples, to estimate eight growth parameters.
King George whiting growth model • A Von Bertalanffy based growth model was used to capture the following aspects of whiting growth: • In addition to the three standard Von Bertalanffy parameters (K, L, t0), • it resolved growth seasonally (2 parameters), • and described the the normal standard deviation of the spread of fish lengths, written as an allometric function of mean length at each monthly age (2 parameters).
King George whiting growth model (cont.) • We also added an additional exponent parameter to generalise the Von Bertalanffy growth curve for mean length at age. • This growth model and fit to King George whiting data is summarised by McGarvey and Fowler (2002. Fishery Bulletin 100: 545-558).
Recruitment • Fish are ‘born’ into the model population as a single normal cohort at age 1, well below harvestable size. • The number of 1-year-old fish in each yearly cohort (and by region) is a freely estimated number. • King George whiting grow steadily into legal size over the months of late summer and autumn (when water temperatures are warmer). • Exploitation is highest on whiting in the winter. • The following summer, they migrate offshore to lower exploitation areas.
Model Algorithm for Creating Slices • As fish grow, in each monthly time step, some of those fish reach the legal minimum length. • That is, some portion of the normal distribution of lengths, the sublegals, fall below this LML line, and some, the faster growing ones, fall above it. • To capture this monthly change in recruitment to legal size and subsequent harvest, a monthly model time step was needed.
Algorithm for Creating Slices (cont.) • Each slice of fish, is created from those that grow into the legal-size (> LML) in each successive model time step. • Using the normal distribution of fish lengths in each time step, an algorithm was constructed that • Determines the separation points between slices, and • calculates the proportions of fish that are assigned from the sublegal subpopulation into each newly created slice, in each monthly time step.
Example of length-slice decomposition of a normal cohort crossing LML
The Two Objectives Are Attained: • The slices cleanly separate legal from sublegal fish. • One new slice is hived off (created) from the sublegals in each time step.
Advantages in fitting to catches-at-age • The numbers of fish in each age group, notably for younger ages where most of catch comes from, is strongly affected by the on-going process of recruitment of fish each month, as they grow above legal size. • Thus, time-varying numbers at age in the legal size range, and thus the catch proportions at age, are modelled by the slice growth method. • Age-only models can do this, roughly by assuming fixed fractions recruited, but they cannot estimate how this would vary under differing levels of growth, fishing mortality, or selectivity.
Further slice-growth features • Fish in each slice, once created, can only die (due to harvesting and natural mortality) or move to other model spatial cells. • (There is no exchange of fish among slices.) • for fishery model fitting purposes, growth of fish in each slice is, mainly accounted for as increasing mean fish weight. • Slices also account for one process that age-only models usually cannot, namely the more rapid depletion of faster growing fish, who grow to legal (or meshable) size sooner.
Mean weights by age and length slice • We integrate the weight-length relationship under the normal length distribution to calculate the mean weights of fish in each slice. • This integration is done over the length interval defining each legal slice, for each model time step. • This yields a matrix of mean fish weights for each age and length slice. • These are used in calculating model catch totals by weight, for fitting to commercial catch data.
Advantages for fitting to catch totals • Slices can provide a generally accurate model-predicted measure of catch total, because: • It cleanly separates legal from sublegal fish. • It explicitly accounts for • The numbers of fish recruiting to legal size over successive time steps, and • The numbers of faster growing fish depleting in larger slices.
Stock Assessment Model • King George whiting migrate from inshore fishing grounds where exploitation is high, to offshore spawning grounds where exploitation is low, in the summer or two after reaching legal size. • Therefore the model must be spatially specific. • A migration matrix was estimated from tag-recoveries (McGarvey & Feenstra 2002, Can J Fish Aquatic Sci 59: 1054) • The model population array is broken down by 5 independent variables: • time step, spatial cell, sex, age, slice.
One limitation of a slice-based approach • The number of slices is constrained by the number of model time steps over which cohorts recruit to legal size. • However, often in cases where a more highly resolved length break-down is needed, namely when growth is rapid, it is also valuable to have more time steps per year. • So sometimes this constraint is not problematic. • But not always.
Comparison with Growth Groups • Punt and Cao independently developed a similar method to slices. • Both methods • partition each age cohort into length bins, and • both assume no movement of fish between length bins. • Potentially one advantage of slices is that they require only a single set of growth parameters, whereas growth groups have a separate set of growth parameters for each growth group.
Research funded by the Australian Fisheries Research and Development Corporation FRDC Project Nos. 95/008 & 2000/195
Ageing by Otoliths • Fishery biologists age individual sampled fish by • removing the otoliths (ear bones), • sectioning the otoliths into thin slices, • examining them under a low-power microscope • counting the rings, to give the age of the fish, usually in years of age subsequent to a known spawning time.
Advantages in fitting to catch totals • The model numbers of fish in each slice are multiplied by mean weight in each slice and summed over sex, age and length slice to give the model-predicted catch total by weight. • This provides a generally accurate model-predicted measure of catch total, because: • It cleanly separates legal from sublegal fish. • The numbers of fish recruiting to legal size over successive time steps, and • The numbers of faster growing fish depleting in larger slices is explicitly accounted for.
Recruitment • Fish are ‘born’ into the model population as a single normal cohort at age 1, well below harvestable size. • The number of 1-year-old fish in each yearly cohort (and by region) is a freely estimated number. • Once they recruit to the legal stock, growing steadily into legal size over the months of late summer and autumn, before migrating offshore, they are subject to quite levels of exploitation. • Exploitation is highest on whiting in the winter.