Download
1 / 1
10 likes | 152 Views
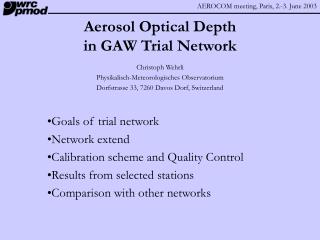
Melpitz. San Pietro Capofiume. San Pietro Capofiume, June/July 2009. Hohenpeißenberg, 1998-99. Melpitz, May 2008. Sulfuric Acid Measurements by CIMS – Uncertainties and Consistency between Various Data Sets C. PLASS-DÜLMER 1 , T. ELSTE 1 , P. PAASONEN 2 , and T. PETÄJÄ 2

E N D
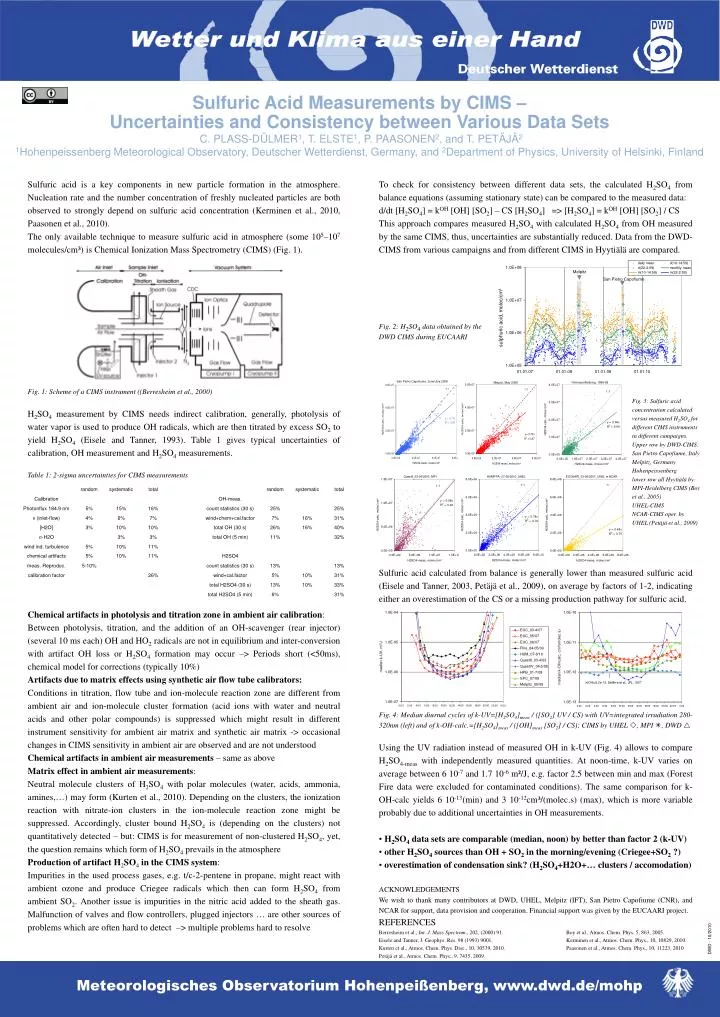
Melpitz San Pietro Capofiume San Pietro Capofiume, June/July 2009 Hohenpeißenberg, 1998-99 Melpitz, May 2008 Sulfuric Acid Measurements by CIMS – Uncertainties and Consistency between Various Data Sets C. PLASS-DÜLMER1, T. ELSTE1, P. PAASONEN2, and T. PETÄJÄ2 1Hohenpeissenberg Meteorological Observatory, Deutscher Wetterdienst, Germany, and 2Department of Physics, University of Helsinki, Finland Sulfuric acid is a key components in new particle formation in the atmosphere. Nucleation rate and the number concentration of freshly nucleated particles are both observed to strongly depend on sulfuric acid concentration (Kerminen et al., 2010, Paasonen et al., 2010). The only available technique to measure sulfuric acid in atmosphere (some 105–107 molecules/cm³) is Chemical Ionization Mass Spectrometry (CIMS) (Fig. 1). Fig. 1: Scheme of a CIMS instrument ((Berresheim et al., 2000) H2SO4 measurement by CIMS needs indirect calibration, generally, photolysis of water vapor is used to produce OH radicals, which are then titrated by excess SO2 to yield H2SO4 (Eisele and Tanner, 1993). Table 1 gives typical uncertainties of calibration, OH measurement and H2SO4 measurements. Table 1: 2-sigma uncertainties for CIMS measurements Chemical artifacts in photolysis and titration zone in ambient air calibration: Between photolysis, titration, and the addition of an OH-scavenger (rear injector) (several 10 ms each) OH and HO2 radicals are not in equilibrium and inter-conversion with artifact OH loss or H2SO4 formation may occur –> Periods short (<50ms), chemical model for corrections (typically 10%) Artifacts due to matrix effects using synthetic air flow tube calibrators: Conditions in titration, flow tube and ion-molecule reaction zone are different from ambient air and ion-molecule cluster formation (acid ions with water and neutral acids and other polar compounds) is suppressed which might result in different instrument sensitivity for ambient air matrix and synthetic air matrix -> occasional changes in CIMS sensitivity in ambient air are observed and are not understood Chemical artifacts in ambient air measurements – same as above Matrix effect in ambient air measurements: Neutral molecule clusters of H2SO4 with polar molecules (water, acids, ammonia, amines,…) may form (Kurten et al., 2010). Depending on the clusters, the ionization reaction with nitrate-ion clusters in the ion-molecule reaction zone might be suppressed. Accordingly, cluster bound H2SO4 is (depending on the clusters) not quantitatively detected – but: CIMS is for measurement of non-clustered H2SO4, yet, the question remains which form of H2SO4 prevails in the atmosphere Production of artifact H2SO4 in the CIMS system: Impurities in the used process gases, e.g. t/c-2-pentene in propane, might react with ambient ozone and produce Criegee radicals which then can form H2SO4 from ambient SO2. Another issue is impurities in the nitric acid added to the sheath gas. Malfunction of valves and flow controllers, plugged injectors … are other sources of problems which are often hard to detect –> multiple problems hard to resolve • To check for consistency between different data sets, the calculated H2SO4 from balance equations (assuming stationary state) can be compared to the measured data: • d/dt [H2SO4] = kOH [OH] [SO2] – CS [H2SO4] => [H2SO4] = kOH [OH] [SO2] / CS • This approach compares measured H2SO4 with calculated H2SO4 from OH measured by the same CIMS, thus, uncertainties are substantially reduced. Data from the DWD-CIMS from various campaigns and from different CIMS in Hyytiälä are compared. • Fig. 2: H2SO4 data obtained by the • DWD CIMS during EUCAARI • Sulfuric acid calculated from balance is generally lower than measured sulfuric acid (Eisele and Tanner, 2003, Petäjä et al., 2009), on average by factors of 1-2, indicating either an overestimation of the CS or a missing production pathway for sulfuric acid. • Fig. 4: Median diurnal cycles of k-UV=[H2SO4]meas / ([SO2] UV / CS) with UV=integrated irradiation 280-320nm (left) and of k-OH-calc.=[H2SO4]meas / ([OH]meas [SO2] / CS); CIMS by UHEL , MPI , DWD r • Using the UV radiation instead of measured OH in k-UV (Fig. 4) allows to compare H2SO4-meas with independently measured quantities. At noon-time, k-UV varies on average between 6 10-7 and 1.7 10-6 m²/J, e.g. factor 2.5 between min and max (Forest Fire data were excluded for contaminated conditions). The same comparison for k-OH-calc yields 6 10-13(min) and 3 10-12cm³/(molec.s) (max), which is more variable probably due to additional uncertainties in OH measurements. • H2SO4 data sets are comparable (median, noon) by better than factor 2 (k-UV) • other H2SO4 sources than OH + SO2 in the morning/evening (Criegee+SO2 ?) • overestimation of condensation sink? (H2SO4+H2O+… clusters / accomodation) • ACKNOWLEDGEMENTS • We wish to thank many contributors at DWD, UHEL, Melpitz (IFT), San Pietro Capofiume (CNR), and NCAR for support, data provision and cooperation. Financial support was given by the EUCAARI project. • REFERENCES • Berresheim et al., Int. J. Mass Spectrom., 202, (2000) 91. Boy et al., Atmos. Chem. Phys. 5, 863, 2005. • Eisele and Tanner, J. Geophys. Res. 98 (1993) 9001. Kerminen et al., Atmos. Chem. Phys., 10, 10829, 2010. • Kurten et al., Atmos. Chem. Phys. Disc., 10, 30539, 2010. Paasonen et al., Atmos. Chem. Phys., 10, 11223, 2010 • Petäjä et al., Atmos. Chem. Phys., 9, 7435, 2009. Melpitz Fig. 3: Sulfuric acid concentration calculated versus measured H2SO4 for different CIMS instruments in different campaigns. Upper row by DWD-CIMS: San Pietro Capofiume, ItalyMelpitz, GermanyHohenpeissenberglower row all Hyytiälä by:MPI-Heidelberg CIMS (Boy et al., 2005)UHEL-CIMSNCAR-CIMS oper. by UHEL (Petäjä et al., 2009) DWD - 10/2010 Meteorologisches Observatorium Hohenpeißenberg, www.dwd.de/mohp