Download
1 / 12
150 likes | 613 Views
Chi-Square Test of Independence. The table below shows the importance of personal appearance for several age groups. Are Age and Appearance independent, or is there a relationship?. Chi-Square Test of Independence. A stacked bar chart suggests a relationship:.

E N D
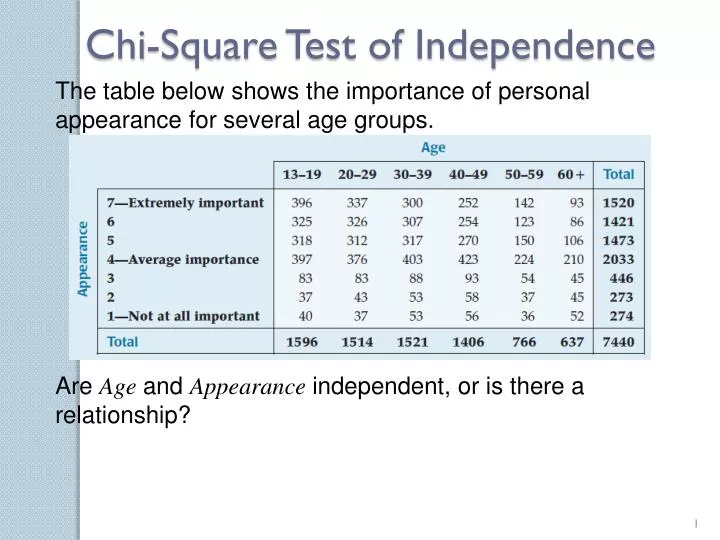
Chi-Square Test of Independence The table below shows the importance of personal appearance for several age groups. Are Age and Appearance independent, or is there a relationship?
Chi-Square Test of Independence A stacked bar chart suggests a relationship: Test for independence using a chi-square test of independence.
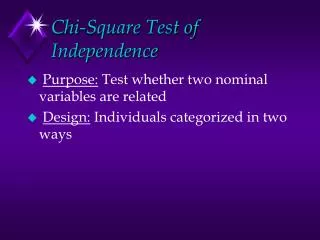
Chi-Square Test of Independence • The test is mechanically equivalent to the test for homogeneity, but with some differences in how we think about the data and the results: • Homogeneity Test: one variable (Card Type) measured on two or more populations (Mailings). • Independence Test: Two variables (Appearance and Age) measured on a single population. • We ask the question “Are the variables independent?” rather than “Are the groups homogeneous?” This subtle distinction is important when drawing conclusions.
Chi-Square Test of Independence Assumptions and Conditions • Counted Data Condition – Data must be counts • Independence Assumption – Counts need to be independent from each other. Check for randomization • Randomization Condition – Random sample needed • Sample Size Assumption – There must be enough data so check the following condition. • Expected Cell Frequency Condition – Expect at least 5 individuals per cell.
Chi-Square Test of Independence Example : Automobile Manufacturers Consumer Reports uses surveys to measure reliability in automobiles. Annually they release survey results about problems that consumers have had with vehicles in the past 12 months and the origin of manufacturer. Is consumer satisfaction related to country of origin? State the hypotheses. Find the test statistic. Given the p-value, state your conclusion.
Chi-Square Test of Independence Example : Automobile Manufacturers
Chi-Square Test of Independence Example : Automobile Manufacturers Consumer Reports uses surveys to measure reliability in automobiles. Annually they release survey results about problems that consumers have had with vehicles in the past 12 months and the origin of manufacturer. Is consumer satisfaction related to country of origin? State the hypotheses. Find the test statistic. Given p-value = 0.231, state your conclusion. There is not enough evidence to conclude there is an association between vehicle problems and origin of vehicle.
Chi-Square Test of Independence For the Appearance and Age example, we reject the null hypothesis that the variables are independent. So, it may be of interest to know how differently two age groups (teens and 30-something adults) select the “very important” category (Appearance response 6 or 7). Construct a confidence interval for the true difference in proportions…
Don’t use chi-square methods unless you have counts. • Beware large samples! With a sufficiently large sample size, a chi-square test can always reject the null hypothesis. • Don’t say that one variable “depends” on the other just because they’re not independent.
Goodness-of-Fit Tests The Chi-Square Calculation Find the expected values. These come from the null hypothesis value. Compute the residuals, Square the residuals, Compute the components. Find for each cell. Find the sum of the components, Find the degrees of freedom Test the hypothesis, finding the p-value or comparing the test statistic from 5 to the appropriate critical value.
Looking back • Recognize when a chi-square test of goodness of fit, homogeneity, or independence is appropriate. • Assumptions—same! • Mechanics—same! • Interpretation—(slightly) different!