Download
1 / 51
520 likes | 758 Views
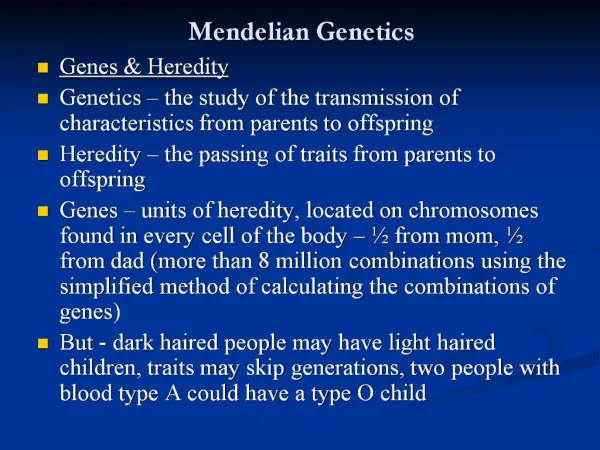
Extending Mendelian Genetics. Chapter 12 (YES that is the correct chapter). Simple Mendelian genetics. Makes a couple of assumptions Organisms are genetically simple Traits are controlled by a single gene Each gene has only 2 alleles One allele is completely dominant over the other

E N D
Extending Mendelian Genetics Chapter 12 (YES that is the correct chapter)
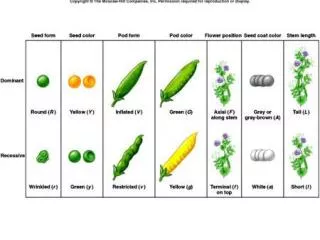
Simple Mendelian genetics • Makes a couple of assumptions • Organisms are genetically simple • Traits are controlled by a single gene • Each gene has only 2 alleles • One allele is completely dominant over the other • It is rarely this simple
Incomplete dominance • Heterozygotes show an intermediate phenotype • RR= red flowers • rr= white flowers • Rr= pink flowers • Blending theory? Why or why not?
Co-dominance • In heterozygotes, both alleles appear phenotypically as individual distinct traits • White • Black • Roan
Co-dominance in blood types • ABO blood groups • 3 alleles= IA, IB, and i • IA and IB are dominant over I • IA and IB are co-dominant to each other • Determines the presence of specific oligosaccharides on the surface of red blood cells
Blood compatibility • Matching compatible blood groups is critical for blood transfusions • A person produces antibodies against foreign oligosaccharides • If donor’s blood has an A or B oligosaccharide that is foreign to the recipient, antibodies in the recipient’s blood will bind to the foreign oligosaccharides • Causes the donated blood cells to clump together and can result in death for the recipient
Pleiotropy • One gene affects more than one phenotypic character • MOST are pleiotropic • Wide ranging effects due to a single gene • Dwarfism • Gigantism
Pleiotropy • Pleiotropic allele may be dominant with respect to one trait and recessive with respect to another • Effects often hard to predict • Many inherited disorders in humans • Sickle cell anemia • Timothy disease
Epistasis • One gene masks another • Products of genes interact with each other • Coat color in mice=2 genes • C=pigment • c=no pigment • B=black pigment • b= brown pigment • If cc is present, then albino (no coat color) regardless of BB, Bb or bb
Epistasis in Labrador retrievers • EE or Ee= dark pigment (black coat color) • ee= no pigment (yellow coat color) • BB= dark pigment deposition (black coat color) • bb= light pigment deposition (chocolate coat color) • Doesn’t affect just coat color • eebb=yellow dogs with brown on nose, lips and eye rims • eeB_=yellow dogs with black pigment on nose, lips and eye rims
Polygenic inheritance • Phenotype is determined by an additive effect of 2 or more genes acting on a single character • Phenotypes on a continuum • Human polygenic traits • Skin color • Height • Weight • Eye color • Intelligence • behaviors
Nature vs. Nurture • The interaction of genes and environment control phenotype • Hotly contested debate
Examples of nature v. nurture • A tree can have leaves that vary in shape, size and color depending on exposure to wind and sun • In humans • nutrition influences height • Exercise alters build • Sun exposure darkens skin • Experience improves performance on intelligence tests • Even identical twins (genetic equals) accumulate phenotypic differences due to unique experiences
Chromosome Theory of Inheritance • Walter S. Sutton, Theodore Boveri and others (~1902) • Mendelian genes have specific loci on chromosomes • The chromosomes segregate and undergo independent assortment
Thomas Hunt Morgan • First to associate a specific gene with a specific chromosome • Drosophilia Melanogaster • Common fruit fly • Fly room • Why flies? • Prolific breeders • New generation every 2 weeks • 4 pairs of chromosomes
Fruit Flies • Took Morgan a year of breeding flies to get a mutant • Male with white eyes • Wild type is red
Discovery of Sex linkage • Mated • P1=White eyed male X red eye female • F1=all red eyes (red is dominant) • P2=Red eye F1 • F2=3:1 phenotypic ratio • Only the males had white eyes • ½ red, ½ white • All females were red eyes • Eye color is linked to X
Sex linked genes • Morgan’s evidence of sex linkages added credibility to the chromosome theory of inheritance
Linked genes • Far more genes than chromosomes • Each chromosome has 100’s of genes • Genes on the same chromosome tend to be inherited as a unit • Linked genes • Linked genes don’t produce typical Mendelian results in breeding experiments • When linked they are unable to assort independently
Complete the following cross • In flies Wild type flies have gray bodies (b+) and normal wings (vg+) the mutant flies have black body (b) and vestigial wings (vg)(much smaller than normal). What is the genotype for all the flies in the F1 generation?
Resulting F1 flies were all hybrids presenting the wild type (gray bodies and vestigial wings)
F2 • What is the expected ratio of phenotypes when you mate one of the hybrids from the F1 with an individual that is homozygous recessive for both traits? • This is a testcross
Linkage • These results indicated that body type and wing shape are inherited together • So how do you explain the black, normal and the gray, vestigial
Test cross • Peas • Heterozygous for yellow round crossed with homozygous for green wrinkled • YyRr X yyrr • ½ of phenotypes match original P phenotypes • Either yellow round or green wrinkled • ½ have a new combination of traits • Green round or Yellow wrinkled
Unlinked genes • Show a 50% recombination • Indicates separate chromosomes for these genes • Not Linked genes • This form of recombination is the result of independent assortment of chromosomes and therefore alleles • Seed color gene has no bearing on the seed shape gene
Recombination between linked genes • Refer back to Morgan’s dihybrid test cross • Assuming linkage between body and wing, expected 1:1:0:0 • How do you explain the alternate phenotypes?
Crossing over • Lets watch the animation • Percentage of recombinants (recombination frequency) is related to the distance between linked genes
Long story short • A genetic map of loci can be made using percentage of crossing over between linked genes • The more often genes cross over, the farther apart they are • The closer two genes are together, the less they cross over • Linkage map=a genetic map based on recombination frequencies
Figuring out a linkage map • Three gene loci • Body color (b) • Wing size (vg) • Cinnabar (affects eye color) (cn) • Recombination frequency • Between cn and b =9% • Between cn and vg = 9.5 % • Between b and vg = ~17 %
So… • cn is about midway between b and vg • Distance between gene is measured in map units • 1 map unit is equal to 1% recombination frequency (centimorgan-in honor of Thomas Morgan)
Did you notice… • The three recombination frequencies in the example given don’t quite add up • 9% (b-cn) + 9.5% (cn-vg)>17% (b-vg) • This results from multiple crossing over events • A second crossing over event “cancels out” the first and reduces the observed number of recombinant offspring • Genes farther apart (b-vg) are more likely to experience multiple crossing over events
Genes that are very far apart • If genes are far apart on a chromosome, then recombination is almost a certainty • Maximum recombination frequency between genes is 50% • This is indistinguishable from genes on different chromosomes
In fact.. • Two of Mendel’s genes (seed color and flower color) are on the same chromosome but still assort independently
Misc. • Genes located far apart on a chromosome are mapped by adding the recombination frequencies between the distant genes and intervening genes • A linkage map is an imperfect picture of a chromosome • Map units indicate relative distance and order, NOT precise location • Frequency of crossing over is not actually uniform over the length of a chromosome
Combined with other methods • Chromosomal banding • Cytogenetic maps can be produced • Indicate positions of genes with respect to chromosomal features • Recent techniques show physical distances between gene loci in DNA nucleotides
Think about it: Determine the sequence of genes along a chromosome based on the following recombination frequencies: A –B , 8 map units; A –C , 28 map units; A –D, 25 map units; B –C, 20 map units; B –D, 33 map units.
Think about it: Genes A, B, C, and D are located on the same chromosome. After calculating recombination frequencies, a student determines that these genes are separated by the following map units: C–D: 25 map units; A–B: 12 map units; B–D: 20 map units; and A–C: 17 map units.