Download
1 / 1
10 likes | 113 Views
Measuring carbon balances in the Amazon basin: II. A new instrument for long-term eddy fluxes and high-accuracy [CO 2 ] in the tropics B.C. Daube 1 , S.R. Saleska 1† , J. W. Munger 1 , S. C. Wofsy 1 , V.W.J.H. Kirchhoff 2

E N D
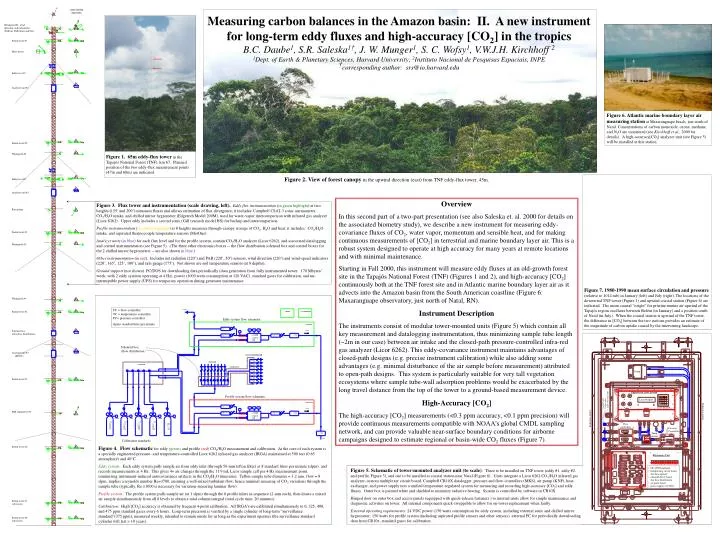
Measuring carbon balances in the Amazon basin: II. A new instrument for long-term eddy fluxes and high-accuracy [CO2] in the tropics B.C. Daube1, S.R. Saleska1†, J. W. Munger1, S. C. Wofsy1, V.W.J.H. Kirchhoff 2 1Dept. of Earth & Planetary Sciences, Harvard University; 2Instituto Nacional de Pesquisas Espaciais, INPE †corresponding author: srs@io.harvard.edu Windspeed #1, wind direction, and radiometers (PAR up, PAR down and Net) Profile level #1 Hoist boom Eddy level #1 Analyzer unit #1 Profile level #2 Figure 1. 65m eddy-flux tower in the Tapajós National Forest (TNF), km 67. Planned position of the two eddy-flux measurement points (47m and 60m) are indicated. Windspeed #2 Eddy level #2 Analyzer unit #2 Figure 3. Flux tower and instrumentation (scale drawing, left).Eddy flux instrumentation (in green highlight) at two heights (155’ and 200’) measures fluxes and allows estimation of flux divergence; it includes: Campbell CSAT-3 sonic anemometer, CO2/H2O intake, and chilled mirror hygrometer (Edgetech Model 200M), used for water-vapor intercomparison with infrared gas analyzer (Licor 6262). Upper eddy includes a second sonic (Gill research model HS) for backup and intercomparison. Profile instrumentation (in yellow highlight) at 8 heights measures through-canopy storage of CO2, H2O and heat; it includes: CO2/H2O intake, and aspirated thermocouple temperature sensors (MetOne). Analyzer units (in blue) for each flux level and for the profile system, contain CO2/H2O analyzer (Licor 6262), and associated datalogging and control instrumentation (see Figure 5). (The three other electronics boxes -- the flow distribution solenoid box and control boxes for the 2 chilled mirror hygrometers -- are also shown in blue.) Other instrumentation (in red). Includes net radiation (220’) and PAR (220’, 50’) sensors, wind direction (220’) and wind-speed indicators (220’, 165’, 125’, 100’), and rain gauge (175’). Not shown are soil temperature sensors (at 8 depths). Ground support (not shown). PC/DOS for downloading data periodically (data generation from fully instrumented tower: 170 Mbytes/ week, with 2 eddy systems operating at 4 Hz), power (1000 watts consumption at 120 VAC), standard gases for calibration, and un-interruptible power supply (UPS) for temporary operation during generator maintenance. Rain gauge Profile level #3 Windspeed #3 Windspeed #4 Profile level #4 Solenoid box (tube-flow distribution) Analyzer unit #3 (profile) Profile level #5 PAR radiometer #2 Profile level #6 Profile level #7(off-tower) Profile level #8(off-tower) N cross-section (top view) Figure 6. Atlantic marine boundary layer air measuring station at Maxaranguape beach, just north of Natal. Concentrations of carbon monoxide, ozone, methane, and N2Oare monitored (see Kirchhoff et al., 2000 for details). A high-accuracy[CO2] analyzer unit (see Figure 5) will be installed at this station. Figure 2. View of forest canopy in the upwind direction (east) from TNF eddy-flux tower, 45m. Overview In this second part of a two-part presentation (see also Saleska et. al. 2000 for details on the associated biometry study), we describe a new instrument for measuring eddy-covariance fluxes of CO2, water vapor, momentum and sensible heat, and for making continuous measurements of [CO2] in terrestrial and marine boundary layer air. This is a robust system designed to operate at high accuracy for many years at remote locations and with minimal maintenance. Starting in Fall 2000, this instrument will measure eddy fluxes at an old-growth forest site in the Tapajós National Forest (TNF) (Figures 1 and 2), and high-accuracy [CO2] continuously both at the TNF forest site and in Atlantic marine boundary layer air as it advects into the Amazon basin from the South American coastline (Figure 6: Maxaranguape observatory, just north of Natal, RN). Instrument Description The instruments consist of modular tower-mounted units (Figure 5) which contain all key measurement and datalogging instrumentation, thus minimizing sample tube length (~2m in our case) between air intake and the closed-path pressure-controlled infra-red gas analyzer (Licor 6262). This eddy-covariance instrument maintains advantages of closed-path designs (e.g. precise instrument calibration) while also adding some advantages (e.g. minimal disturbance of the air sample before measurement) attributed to open-path designs. This system is particularly suitable for very tall vegetation ecosystems where sample tube-wall adsorption problems would be exacerbated by the long travel distance from the top of the tower to a ground-based measurement device. High-Accuracy [CO2] The high-accuracy [CO2] measurements (<0.3 ppm accuracy, <0.1 ppm precision) will provide continuous measurements compatible with NOAA’s global CMDL sampling network, and can provide valuable near-surface boundary conditions for airborne campaigns designed to estimate regional or basin-wide CO2 fluxes (Figure 7). Figure 7. 1980-1990 mean surface circulation and pressure (relative to 1014 mb) in January (left) and July (right). The locations of the downwind TNF tower (Figure 1) and upwind coastal station (Figure 6) are indicated. The mean coastal “origin” for pristine marine air upwind of the Tapajós region oscillates between Belém (in January) and a position south of Natal (in July). When the coastal station is upwind of the TNF tower, the difference in [CO2] between the two stations provides an estimate of the magnitude of carbon uptake caused by the intervening landscape. FC = flow-controllerTC = temperature-controllerPC= pressure-controller slpm= standard liter per minute Eddy system flow schematic Solenoid box(flow distribution) Pump Engineered Licor System Profile system flow schematic Licor reference inlet Licor Display Calgas inlet Sample inlet Licor keypad Radiation shield Radiation shield Flow controllers Pressure Controller Temp control Calibration Calibration standards Sample Figure 4. Flow schematic for eddy (green)and profile (red) CO2/H2O measurement and calibration. At the core of each system is a specially engineered pressure- and temperature-controlled Licor 6262 infrared gas analyzer (IRGA) maintained at 500 torr (0.65 atmosphere) and 40°C. Eddy system: Each eddy system pulls sample air from eddy inlet (through 50-mm teflon filter) at 8 standard liters per minute (slpm), and records measurements at 4 Hz. This gives 4+ air changes through the 11.9 mL Licor sample cell per 4 Hz measurement point, minimizing instrument-induced autocovariance artifacts in the CO2/H2O timeseries. Teflon sample tube diameter = 3.2 mm, flow = 8 slpm, implies a reynolds number Re=3700, ensuring a well-mixed turbulent flow, hence minimal smearing of CO2 variations through the sample tube (typically, Re 1000 is necessary for variation-smearing laminar flow). Profile system: The profile system pulls sample air (at 1 slpm) through the 8 profile inlets in sequence (2-min each), then draws a mixed air sample simultaneously from all 8 levels to obtain a total column integral (total cycle time: 20 minutes). Calibration: High [CO2] accuracy is obtained by frequent 4-point calibration. All IRGA’s are calibrated simultaneously to 0, 325, 400, and 475 ppm standard gases every 6 hours. Long-term precision is verified by a single cylinder of long-term “surveillance standard”(375 ppm), measured weekly, intended to remain onsite for as long as the experiment operates (the surveillance standard cylinder will last > 10 years). Electronics Unit • CR-10X Datalogger • multiplexing circuit board (for data signals) • solenoid driver board (for flow distribution) • set-point board • power supply (24 VDC) Figure 5. Schematic of tower-mounted analyzer unit (to scale): Three to be installed on TNF tower (eddy #1, eddy #2, and profile, Figure 3), and one to be installed at coastal station near Natal (Figure 6). Units integrate a Licor 6262 CO2/H2O infrared gas analyzer, custom multiplexer circuit board, Campbell CR10X datalogger, pressure and flow-controllers (MKS), air pump (KNF), heat-exchanger, and power supply into a unified temperature-regulated system for measuring and recording high-accuracy [CO2] and eddy fluxes. Outer box is painted white and shielded to minimize radiative heating. System is controlled by software in CR10X. Hinged door on outer box and access panels (equipped with quick-release fasteners ) to internal units allow for simple maintenance and diagnostic activities on tower. All internal components quick-swappable to allow for on-tower replacement when faulty. External operating requirements: 24 VDC power (150 watts consumption for eddy system, including external sonic and chilled mirror hygrometer; 150 watts for profile system (including aspirated profile sensors and other sensors), external PC for periodically downloading data from CR10x, standard gases for calibration.