Download
1 / 1
10 likes | 116 Views
ASSESSING SEARCH TERM STRENGTH IN SPOKEN TERM DETECTION Amir Harati and Joseph Picone Institute for Signal and Information Processing, Temple University. www.isip.piconepress.com. Introduction

E N D
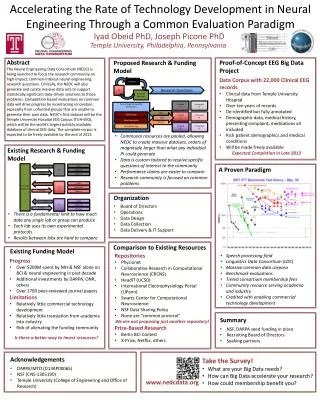
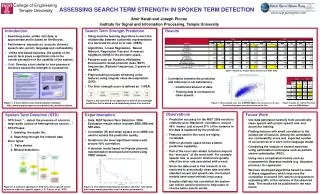
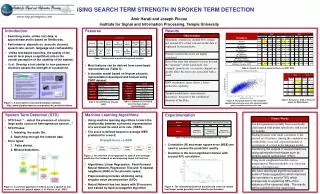
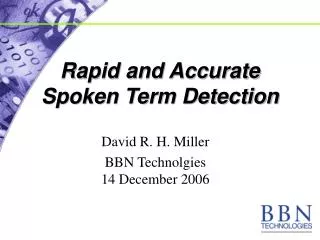
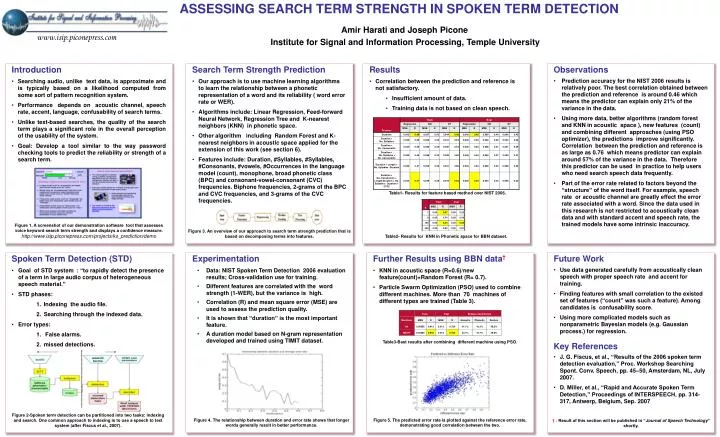
ASSESSING SEARCH TERM STRENGTH IN SPOKEN TERM DETECTIONAmir Harati and Joseph Picone Institute for Signal and Information Processing, Temple University www.isip.piconepress.com • Introduction • Searching audio, unlike text data, is approximate and is typically based on a likelihood computed from some sort of pattern recognition system. • Performance depends on acoustic channel, speech rate, accent, language, confusability of search terms. • Unlike text-based searches, the quality of the search term plays a significant role in the overall perception of the usability of the system. • Goal: Develop a tool similar to the way password checking tools to predict the reliability or strength of a search term. • Search Term Strength Prediction • Our approach is to use machine learning algorithms to learn the relationship between a phonetic representation of a word and its reliability ( word error rate or WER). • Algorithms include: Linear Regression, Feed-forward Neural Network, Regression Tree and K-nearest neighbors (KNN) in phonetic space. • Other algorithm including Random Forest and K-nearest neighbors in acoustic space applied for the extension of this work (see section 6). • Features include: Duration, #Syllables, #Syllables, #Consonants, #vowels, #Occurrences in the language model (count), monophone, broad phonetic class (BPC) and consonant-vowel-consonant (CVC) frequencies. Biphone frequencies, 2-grams of the BPC and CVC frequencies, and 3-grams of the CVC frequencies. • Results • Correlation between the prediction and reference is not satisfactory. • Insufficient amount of data. • Training data is not based on clean speech. • Observations • Prediction accuracy for the NIST 2006 results is relatively poor. The best correlation obtained between the prediction and reference is around 0.46 which means the predictor can explain only 21% of the variance in the data. • Using more data, better algorithms (random forest and KNN in acoustic space ), new features (count) and combining different approaches (using PSO optimizer), the predictions improve significantly. Correlation between the prediction and reference is as large as 0.76 which means predictor can explain around 57% of the variance in the data. Therefore this predictor can be used in practice to help users who need search speech data frequently. • Part of the error rate related to factors beyond the “structure” of the word itself. For example, speech rate or acoustic channel are greatly effect the error rate associated with a word. Since the data used in this research is not restricted to acoustically clean data and with standard accent and speech rate, the trained models have some intrinsic inaccuracy. Table1- Results for feature based method over NIST 2006. Figure 1. A screenshot of our demonstration software tool that assesses voice keyword search term strength and displays a confidence measure. http://www.isip.piconepress.com/projects/ks_prediction/demo Figure 3. An overview of our approach to search term strength prediction that is based on decomposing terms into features. Table2- Results for KNN in Phonetic space for BBN dataset. • Spoken Term Detection (STD) • Goal of STD system : “to rapidly detect the presence of a term in large audio corpus of heterogeneous speech material.” • STD phases: • Indexing the audio file. • Searching through the indexed data. • Error types: • False alarms. • missed detections. • Experimentation • Data: NIST Spoken Term Detection 2006 evaluation results; Cross-validation use for training. • Different features are correlated with the word strength (1-WER), but the variance is high. • Correlation (R) and mean square error (MSE) are used to assess the prediction quality. • It is shown that “duration” is the most important feature. • A duration model based on N-gram representation developed and trained using TIMIT dataset. • Further Results using BBN data† • KNN in acoustic space (R=0.6)/new feature(count)+Random Forest (R= 0.7). • Particle Swarm Optimization (PSO) used to combine different machines. More than 70 machines of different types are trained (Table 3). • Future Work • Use data generated carefully from acoustically clean speech with proper speech rate and accent for training. • Finding features with small correlation to the existed set of features (“count” was such a feature). Among candidates is confusability score. • Using more complicated models such as nonparametric Bayesian models (e.g. Gaussian process.) for regression. • Key References • J. G. Fiscus, et al., “Results of the 2006 spoken term detection evaluation,” Proc. Workshop Searching Spont. Conv. Speech, pp. 45–50, Amsterdam, NL, July 2007. • D. Miller, et al., “Rapid and Accurate Spoken Term Detection,” Proceedings of INTERSPEECH, pp. 314-317, Antwerp, Belgium, Sep. 2007 Table3-Best results after combining different machine using PSO. Figure 2-Spoken term detection can be partitioned into two tasks: indexing and search. One common approach to indexing is to use a speech to text system (after Fiscus et al., 2007). Figure 5. The predicted error rate is plotted against the reference error rate, demonstrating good correlation between the two. Figure 4. The relationship between duration and error rate shows that longer words generally result in better performance. † : Result of this section will be published in “Journal of Speech Technology” shortly.