Download
1 / 29
290 likes | 404 Views
Incumbents winning re-election. Percent. Year. Source: 2002 Statistical Abstract, Table 381; Campaign Finance Institute (www.cfinst.org). Outspending the losers. Incumbents winning re-election. Percent. Year.

E N D
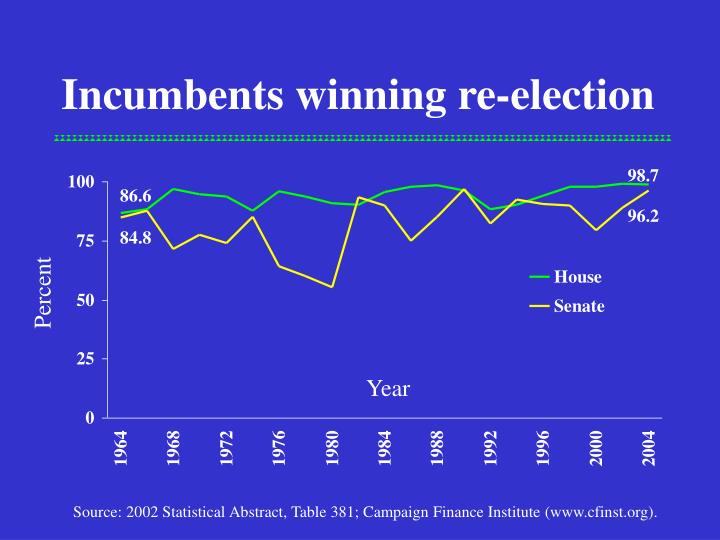
Incumbents winning re-election Percent Year Source: 2002 Statistical Abstract, Table 381; Campaign Finance Institute (www.cfinst.org).
Outspending the losers OpenSecrets.org
Incumbents winning re-election Percent Year Source: 2002 Statistical Abstract, Table 381; Campaign Finance Institute (www.cfinst.org).
Presidential election voting 56.0 Source: 2002 Statistical Abstract, Table 395; Wash Post 1/15/2005 & Census estimate of population, July 1 2003.
Does the power elite lose? • Sometimes • On ‘minor’ issues • When they are divided • After winning compromises • Examples • National Labor Relations Act (1935) • Family and Medical Leave Act (1993)
National Labor Relations Act (1935) • Labor militancy in reaction to the Depression • Ruling class forced to compromise • Protecting union formation, bargaining • Opposed most by Northern industrialists May Day, 1935
Why did they lose – or did they? • Southern and Plains states made a deal • Excluded agricultural, seasonal, and domestic workers from union coverage • The act was later undermined when the economy improved Russell Lee, "Mexican girl carrot worker, Edinburg, Texas." February 1939. Library of Congress.
“To build a stronger American community, we have taken a new approach, rooted in our oldest values, to protecting families and children. I am especially proud of our success in enacting the Family Leave Law.” --Bill Clinton, 10/2/96 (Chicago Sun Times). Family and Medical Leave Act (1993) • Initially opposed by corporate interests and vetoed by Bush Sr.
Family and Medical Leave Act (1993) • Proposed unpaid leave, but at least… • 18 weeks for childbirth, 26 for medical leave • Applied to companies with 15+ workers • Compromise that passed • 12 weeks unpaid, companies with 50+ workers • One-year tenure required • Many part-time workers exempted • Covers about half the workforce
Family income distribution ($2001) 1971 2001 Percent
The shrinking middle class Change in family income distribution, 1971-2001 ($2001) Percent change
Theories of growing inequality • Individual explanations • Social Darwinism • IQ • Structural explanations • Capitalism • Government policy • Deindustrialization • Family structure Beggar, Mercedes: Beijing 2002
Individual explanations Blame the victim: ‘…the people who are left behind [in poverty] are likely to be disproportionately those who suffer not only bad luck, but also a lack of energy, thrift, farsightedness, determination -- and brains.’ --Richard Herrnstein & Charles Murray The Bell Curve (1994), p. 129.
Biology: Social Darwinism ‘The poor … suffered because they were made of inferior stuff; their struggles were simply the manifestation of … natural selection, and to interfere was to doom the society, the race, or even the species as a whole.’ -- Pat Shipman The Evolution of Racism (1994), p. 109
Intelligence Quotient • Herrnstein & Murray, Bell Curve (1994) • More meritocracy means more inequality • IQ is supposed to be inherent intelligence • A fixed quantity of a single essence • Determined at or near birth • It must be measurable with a test • Not knowledge learned in school • Not something cultural
What is missing? Source: 1917 U.S. Army intelligence test, from Stephen Jay Gould, The Mismeasure of Man (1981).
Intelligence and inequality • Even if the assumptions are correct • ‘Intelligence’ leads to class position, if… • Opportunity is equal • Inequality results from individual actions
Why ‘intelligence’ fails • Life, not birth, determines intelligence • Health, social and physical environment • School quality, parents’ education • Opportunity is not equal • Obstacles to education and employment • Discrimination • Inequality is structural, not individual
Structural explanations • Capitalism (see Marx) • Increasing inequality is inevitable in capitalist society • Government policy • Deindustrialization • Economic development, 1970s-present
$7.18 $5.15 Reasons: Government policy • Lower taxes for the rich, welfare cuts • The falling real minimum wage Source: Economic Policy Institute (www.epinet.org).
Reasons: Economic restructuring From manufacturing to services Source: Bureau of Labor Statistics (www.bls.gov).
Earnings: BA versus HS The growing education pay gap Men Women Source: U.S. Census Bureau, March Current Population Survey.
Computer / Internet at home, 2001 (%) Source: Census Bureau (PPL-175).
Deindustrialization • William Julius Wilson • The Truly Disadvantaged (1987) • When Work Disappears (1996) • Flight of industrial manufacturing • From the Midwest and Northeast, to the South, West, and other countries • Growth of service sector jobs • Better (college), worse (no college) • Men’s employment prospects hurt more
No work all year, central city men Source: March Current Population Surveys (ages 25-54).
Chicago high poverty areas 1970 More than 40% of families poor (1 area) Source: William Julius Wilson, The Truly Disadvantaged (1987)
Chicago high poverty areas 1980 40-49% of families poor (7 areas) More than 50% of families poor (2 areas) Source: William Julius Wilson, The Truly Disadvantaged (1987)
Detroit: Change in Number of Jobs, 1980-1990 Gained 20% or more Lost 20% or more Source: Ted Mouw, ASR 65(5), 2000.
Wilson’s theory • Snowball effects • Tax base shrinks • Schools and other infrastructure crumbles • Community organizations weaken • Stronger effect of concentrated poverty • Weak personal networks • Discrimination by neighborhood