Download
1 / 6
60 likes | 134 Views
Hurricane and Severe Storm Sentinel (HS3)—Initial Findings from 2013 Scott Braun (612) and Paul Newman (610), NASA GSFC. 600 hPa. Goal: To examine the processes (environmental vs. internal) that control hurricane intensification.

E N D
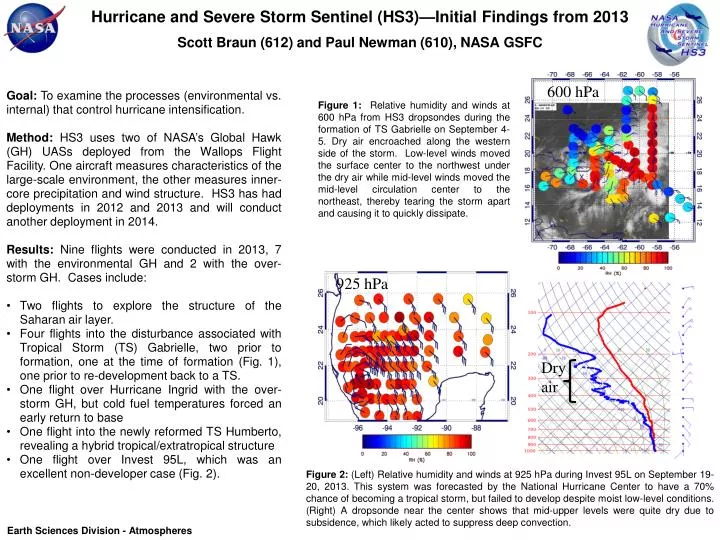
Hurricane and Severe Storm Sentinel (HS3)—Initial Findings from 2013 Scott Braun (612) and Paul Newman (610), NASA GSFC 600 hPa • Goal: To examine the processes (environmental vs. internal) that control hurricane intensification. • Method: HS3 uses two of NASA’s Global Hawk (GH) UASs deployed from the Wallops Flight Facility. One aircraft measures characteristics of the large-scale environment, the other measures inner-core precipitation and wind structure. HS3 has had deployments in 2012 and 2013 and will conduct another deployment in 2014. • Results: Nine flights were conducted in 2013, 7 with the environmental GH and 2 with the over-storm GH. Cases include: • Two flights to explore the structure of the Saharan air layer. • Four flights into the disturbance associated with Tropical Storm (TS) Gabrielle, two prior to formation, one at the time of formation (Fig. 1), one prior to re-development back to a TS. • One flight over Hurricane Ingrid with the over-storm GH, but cold fuel temperatures forced an early return to base • One flight into the newly reformed TS Humberto, revealing a hybrid tropical/extratropical structure • One flight over Invest 95L, which was an excellent non-developer case (Fig. 2). Figure 1:Relative humidity and winds at 600 hPa from HS3 dropsondes during the formation of TS Gabrielle on September 4-5. Dry air encroached along the western side of the storm. Low-level winds moved the surface center to the northwest under the dry air while mid-level winds moved the mid-level circulation center to the northeast, thereby tearing the storm apart and causing it to quickly dissipate. 925 hPa Dry air Figure 2: (Left)Relative humidity and winds at 925 hPa during Invest 95L on September 19-20, 2013. This system was forecasted by the National Hurricane Center to have a 70% chance of becoming a tropical storm, but failed to develop despite moist low-level conditions. (Right) A dropsonde near the center shows that mid-upper levels were quite dry due to subsidence, which likely acted to suppress deep convection. Earth Sciences Division - Atmospheres
Name: Scott Braun, NASA/GSFC, Code 612 E-mail: scott.a.braun@nasa.gov Phone: 301-614-6316 Experiment Overview: The goal of the mission is to improve understanding of the processes that control hurricane formation and intensity change and to determine better the relative roles of the large-scale environment and smaller-scale processes in the inner-core region of storms (i.e., the eyewall and rainbands). One GH (designated the environmental GH) is designed to sample temperature, humidity, winds, and Saharan dust in the storm environment while the other (designated the over-storm GH) is focused on measuring winds and precipitation within the storm. In 2013, both aircraft were deployed to Wallops for the first time. Instruments on the environmental GH included the Cloud Physics Lidar (CPL, NASA/GSFC), the Scanning High-resolution Interferometer Sounder (S-HIS, Univ. of Wisconsin), and the Advanced Vertical Atmospheric Profiling System (AVAPS, NOAA/NCAR). Instruments on the over-storm GH included the High-resolution Imaging Wind and Rain Airborne Profiler (HIWRAP, NASA/GSFC), the Hurricane Imaging Radiometer (HIRAD, NASA/MSFC), and the High-Altitude MMIC Sounding Radiometer (HAMSR, JPL). Over-storm GH flights were limited in 2013 due to infrequent convectively active targets and due to two Return-to-Base flights in which a navigation unit failed. Technical Description of Figures: Figure 1: Example of dropsonde data from the Sept. 4-5 flight of the environmental GH into Tropical Storm Gabrielle on the day it both formed and dissipated. Colored circles represent relative humidity, and winds are shown using wind barbs in which full barbs (half barbs) represent 5 (2.5) m s-1. Data are from the 600 hPa level and are overlaid over a nearly coincident GOES infrared satellite image. Previous flights included an environmental flight (Aug. 29-30) examining the early tropical wave and its interaction with the Saharan Air Layer and an over-storm flight (Sept. 3-4) examining the organization of convection in two adjacent disturbances, one of which became TS Gabrielle. A fourth flight (Sept. 7-8) was conducted when the remnants of TS Gabrielle had a chance of reforming into a TS, but the environment was still too unfavorable. Gabrielle reformed on Sept. 10 (HS3 Media Day) when the over-storm GH was sent out to study it, but the GH had to return quickly due to a navigation unit failure. Figure 2: Dropsonde data from an environmental flight on Sept. 19-20 over a disturbance (called Invest 95L) that had a 70% chance of forming, but did not (by National Hurricane Center determination). Dropsonde data (left panel) did reveal a clear low-level cyclonic circulation and even a possible surface cyclone, so the disturbance was very nearly a tropical depression. The image to the right shows vertical profiles (as a function of pressure altitude) of temperature, dew point temperature, and winds near the center of the disturbance, and reveal that a very moist air mass at low levels was overtopped by a very dry subsiding air mass aloft. This upper environment likely caused deep convection to shut down, preventing significant development. Scientific significance: The Global Hawks provide a valuable capability for mapping out large regions of the storm and its environment. 2013 was unfortunately (for HS3) one of the quietest hurricane seasons since the early 1980’s, providing few good targets. TS Gabrielle and non-developer Invest 95L will likely prove to be the most useful cases in 2013 by shedding light on conditions that proved unfavorable for storm intensification and development. Relevance for Future Missions: This work provides a significant set of observations for understanding how the large-scale environment (including the Saharan air) impacts developing storms and can provide important information for the analysis of data in hurricanes from satellite data such as from TRMM, Aqua, CALIPSO, and NPP. Earth Sciences Division - Atmospheres
New Biomass Burning Smoke Emissions Dataset Fills Gap between Previous Estimations and Expected ValuesLuke Ellison and Charles Ichoku, Code 613, NASA GSFC and SSAI Fires burn extensively in most vegetated parts of the world. Smoke from biomass burning contributes a major portion of the annual carbon emissions to the atmosphere. Thus, an accurate smoke emissions inventory is imperative to correctly understand the impacts of biomass burning on the global climate system and regional environmental dynamics. A major effort to create a new emissions dataset for this very purpose was undertaken during the past several years. The result is the FEER (Fire Energetics and Emissions Research) emissions product, available at http://feer.gsfc.nasa.gov/ data/emissions/. This is a globally gridded product at 1°×1° resolution that is derived from satellite measurements of fire radiative power (FRP) and aerosol optical depth (AOD), in conjunction with model-assimilated wind fields. The building block for the product are emission coefficients that relate FRP directly to smoke emission rate (Fig. 1). The generated FEER smoke aerosol emissions (Fig. 2 & 3) are higher than those of several other emission inventories (e.g. GFED, GFAS), by a factor of 2-4. This agrees with the typical adjustment factors that models apply to make these other inventories consistent with global AOD distributions from satellites. Figure 1: The FEER algorithm is based on observed linear relationship between a fire’s radiative energy release rate or power (FRP) and smoke aerosol emission rate (Rsa). Figure 2: The FEER emissions product has good global coverage. Major burning regions are clearly in Central and Southern African regions, Central S. America and SE Asia. Figure 3: Comparison of several smoke emission datasets commonly used in many science studies with our own FEER emissions. Note that FEER captures significantly more smoke than GFED and GFAS. Earth Sciences Division - Atmospheres
Name: Luke Ellison, NASA/GSFC, Code 613 and SSAI E-mail: luke.ellison@nasa.gov Phone: 301-614-5358References: • Ichoku, C. and L. Ellison. Global top-down smoke aerosol emissions estimation using satellite fire radiative power measurements. Atmospheric Chemistry and Physics Discussions, 13, 27327–27386, 2013. doi:10.5194/acpd-13-27327-2013. • Ichoku, C. and Y J. Kaufman. A method to derive smoke emission rates from MODIS fire radiative energy measurements. IEEE Transactions on Geoscience and Remote Sensing, 43, 2636–2649, 2005. doi:10.1109/TGRS.2005.857328. • Kaiser, J. W., A. Heil, M. O. Andreae, A. Benedetti, N. Chubarova, L. Jones, J.-J. Morcrette, M. Razinger, M. G. Schultz, M. Suttie and G. R. van der Werf. Biomass burning emissions estimated with a global fire assimilation system based on observed fire radiative power. Biogeosciences, 9, 527–554, 2012. • Data Sources: • FEER Coefficients of Emission Product (http://feer.gsfc.nasa.gov/data/emissions/) • MODIS Fire Radiative Power Product (MOD14/MYD14, http://modis-fire.umd.edu/) • MODIS Aerosol Product (MOD04_L2/MYD04_L2, http://modis-atmos.gsfc.nasa.gov/MOD04_L2/) • MERRA Reanalysis Dataset (inst3_3d_asm_Cp, http://disc.sci.gsfc.nasa.gov/mdisc/data-holdings/merra/inst3_3d_asm_Cp.shtml) • GFAS Fire Radiative Power Data and Emissions Product (v1.0, https://www.gmes-atmosphere.eu/services/gac/fire/) • GFED Emissions Product (v3.1, http://www.globalfiredata.org/) • QFED Emissions Product (v2.4, http://geos5.org/wiki/index.php?title=Quick_Fire_Emission_Dataset_%28QFED%29) • Technical Description of Figures: • Figure 1: Scatter plots of smoke emission rate (Rsa) against fire radiative energy release rate or power (FRP or Rfre) derived from both Terra and Aqua MODIS observations during the period 2003–2010 for a 1°×1° grid cell centered at -1.5° latitude and 15.5° longitude. • Figure 2: FEER.v1 estimates of aerosol total particulate matter (TPM) for all of 2010 on a 0.5°×0.5° resolution global grid. These values are generated by multiplying coefficients of emission (Ce) with fire radiative power (FRP), using the FEER.v1 Ce product combined with the GFASv1.0 FRP monthly data. • Figure 3: Time series of yearly total particulate matter (TPM) emissions in Tg from 2000-2012 for FEER.v1, GFED.v3, QFED.v2 and GFAS.v1. QFED.v2 values (dotted line) are for PM2.5 (i.e. particulate matter with aerodynamic diameter less than 2.5 microns). • Scientific significance: Smoke emission have long been calculated by bottom-up approaches, using burned area, fuel content or biomass density, and burn efficiency data, along with experimentally determined emission factors to estimate smoke emissions for any given area. It is easy to see how the uncertainties for these many parameters compound very quickly, with the result that modelers find these emissions to be severely underestimated when their results are compared with satellite aerosol distributions. Besides, the generalized emission factors used in these inventories do not offer much spatial variability. The FEER emissions product is unique in that it directly relates the two quantitative datasets of interest: fire radiative power (FRP) and smoke emissions and provides emission coefficients at a comparatively high spatial resolution (1°×1°) that is easily amenable to verification and validation. • Relevance to future science and NASA missions: Fire is a major contributor of carbon emissions to the climate system, and at a time when climate change is of high scientific significance, an accurate representation of biomass burning emissions is desperately needed to adequately address current and future challenges targeted by various NASA missions related to land-cover change dynamics, carbon emissions, atmospheric composition, and climate. For instance, this FEER emissions product is currently being used in a major interdisciplinary study on how fires impact the devastating droughts in sub-Saharan Africa. Earth Sciences Division - Atmospheres
First Global Free Tropospheric NO2 Concentrations Derived Using a Cloud Slicing Technique Applied to Satellite Observations from the Aura Ozone Monitoring Instrument (OMI) S. Choi1,2, J. Joiner2, Y. Choi3, B. N. Duncan2, E. Bucsela4 1Science Systems and Applications, Inc. (SSAI), 2NASA Goddard Space Flight Center, 3University of Houston, 4SRI Interntaional We use a novel cloud slicing approach to produce the first global maps of free tropospheric nitrogen dioxide (NO2) volume mixing ratios (VMRs). We utilize cloudy NO2 column measurements from the Ozone Monitoring Instrument (OMI) on the NASA Aura spacecraft. NO2 is produced in the troposphere by lightning, in soil, and from combustion. It is an EPA criteria pollutant and precursor of ozone. It is also a climate agent, absorbing sunlight. Enhanced NO2in the free troposphere commonly appears near polluted urban locations where NO2 produced near the surface may be transported vertically out of the boundary layer and then horizontally away from the source. Signatures of lightning NO2 are shown at low and middle latitude regions in summer months (Jun-Aug in the northern hemisphere and Dec-Feb in southern hemisphere). Our technique will enable new evaluations of chemistry transport models, including lightning NOx parameterizations and transport of boundary layer pollution. Free tropospheric NO2 VMR is a value-added OMI product that was not anticipated at launch. Figure 1: These global maps show 3-month seasonal averages of free tropospheric NO2 mixing ratio (gridded at 6o latitude x 8o longitude resolution) for Dec-Feb (top panel) and Jun-Aug (bottom panel) 2005-2007. These maps show clear signatures of anthropogenic contributions near densely populated regions as well as lightning contributions over tropical oceans. Earth Sciences Division - Atmospheres
Name: Sungyeon Choi, Science Systems and Applications, Inc., NASA/GSFC, Code 614 E-mail: sungyeon.choi@nasa.gov Phone: 301-867-2112 Reference: Choi, S., Joiner, J., Choi, Y., Duncan, B. N., and Bucsela, E., 2014: Global free tropospheric NO2 abundances derived using a cloud slicing technique applied to satellite observations from the Aura Ozone Monitoring Instrument (OMI), Atmos. Chem. Phys. Discuss., 14, 1559-1615, 2014, doi:10.5194/acpd-14-1559-2014. Data Sources: Ozone Monitoring Instrument on the Aura spacecraft. Technical Description of Figure: The cloud slicing technique that enables these images uses the above-cloud column NO2 (total column NO2 retrieved in the presence of optically thick clouds) and cloud scene pressure from the OMI rotational-Raman cloud product. Previous studies including Ziemke et al. (2001) showed that ozone column measurements in cloudy scenes can be used to obtain free tropospheric ozone volume mixing ratios (VMRs) in the tropics. We apply a similar technique to NO2 and extend the spatial coverage to higher latitudes. We show maps of a seasonal climatology of free tropospheric NO2 VMR produced with OMI data from 2005-2007. These observations will provide unique data for researchers to study temporal and spatial variations in free tropospheric trace gases. Scientific significance:Measurements of tropospheric NO2 from space-based sensors are of interest to the atmospheric chemistry and air quality communities, because it is an important pollutant as well as a radiative forcing agent. However, estimates of NO2 concentrations in the free-troposphere, where lifetimes are longer and the radiative impact through ozone formation is larger, are severely lacking. Such information is critical to evaluate chemistry-climate and air quality models that are used for prediction of the evolution of tropospheric ozone and its impact on climate and air quality. We retrieve free-tropospheric NO2 VMR using a cloud slicing technique, which utilizes the fact that the slope of the cloudy NO2 column versus the cloud optical centroid pressure is proportional to the NO2 VMR for a given altitude range. This provides a global seasonal climatology of free-tropospheric NO2 VMR in cloudy conditions and also produces estimates of stratospheric column NO2 amounts. The retrieved map of free tropopspheric NO2 VMR shows very distinct spatial and seasonal pattern compared to tropospheric column NO2 from OMI. For example, enhanced NO2 in the free troposphere commonly appears near polluted urban locations where NO2 produced in the boundary layer may be transported vertically out of the boundary layer and then horizontally away from the source. In addition, signatures of lightning NO2 are also shown throughout low and middle latitude regions in summer months. These results demonstrate combination of trace column and cloud measurements can produce unique information of abundances of trace gases in the free troposphere. Relevance for future science and relationship to Decadal Survey: It will also be possible to obtain free tropospheric trace gas abundances (including NO2) using other sensors including the Ozone Mapping Profiler Suite (OMPS) aboard the Suomi National Polar-orbiting Partnership (NPP) and the Earth Ventures Instrument (EV-I) Tropospheric Emissions: Monitoring of Pollution (TEMPO) to be launched into geostationary orbit towards the end of the decade. It will be particularly interesting to observe daily variations in trace gases derived from the cloud slicing approach taking advantage of the high temporal and spatial resolution offered by geostationary missions. Earth Sciences Division - Atmospheres