Download
1 / 18

E N D
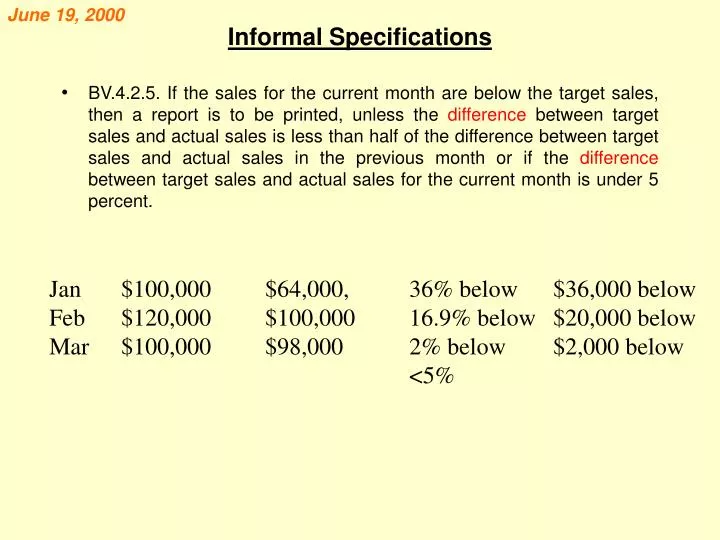
June 19, 2000 Informal Specifications • BV.4.2.5. If the sales for the current month are below the target sales, then a report is to be printed, unless the difference between target sales and actual sales is less than half of the difference between target sales and actual sales in the previous month or if the difference between target sales and actual sales for the current month is under 5 percent. Jan $100,000 $64,000, 36% below $36,000 below Feb $120,000 $100,000 16.9% below $20,000 below Mar $100,000 $98,000 2% below $2,000 below <5%
Informal Specifications • BV.4.2.5. If the sales for the current month are below the target sales, then a report is to be printed, unless the difference between target sales and actual sales is less than half of the difference between target sales and actual sales in the previous month or if the difference between target sales and actual sales for the current month is under 5 percent. • Problems of the specification document • Misinterpret client’s (management) needs • Management wants “percentage difference” • Specification document specifies “absolute value difference” • Ambiguous - the difference (should be percentage difference) between target sales and actual sales for the current month is under 5 percent. • Poor style - Instead of saying “if something happens, don’t print it,” simply state the situations under which the report will be printed
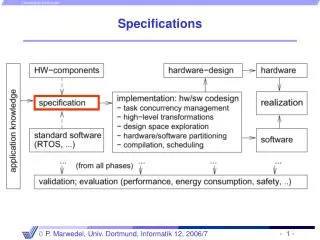
Structured Systems Analysis • Modern Structured Analysis (MSA) [Yourdon, 1989] • Major components of the MSA approach • Statement of Purpose • Event List • Data Flow Diagrams • Context diagram • Leveled data flow diagrams (Level 1, 2, and 3 if necessary) • Data Dictionary • Process Specification • Entity-Relationship (ER) Diagram • State Transition Diagram
Structured Systems Analysis (2) • Statement of Purpose • A brief, concise textual statement of the purpose of the system. • It is intended for top management, user management, and others who are not directly involved in the development of the system. • The statement of purpose can be one, two, or several sentences long. However, it should not be more than a single paragraph, as it is not intended to give a comprehensive, detailed description of the system.
Structured Systems Analysis (3) • Event List • The event list is a narrative list of the "stimuli" that occur in the outside world and to which our system must respond. There are essentially three different types of events: flow-oriented events (labeled as F), temporal events (T), and control events (C). • A flow-oriented event is one associated with a data flow; that is, the system becomes aware that the event has occurred when a piece of data (or possibly several pieces of data) has arrived. • Temporal events are triggered by the arrival of a point in time, not by incoming data flows; one might imagine that the system has an internal clock with which it can determine the passage of time. However, keep in mind also that a temporal event may require the system to ask for inputs from one or more terminators. Thus, one or more data flows may be associated with a temporal event. • Control events could be considered as a special case of temporal event: an external stimulus that occurs at some unpredictable point in time. Unlike the temporal events, the control event is not associated with the regular passage of time, so the system cannot anticipate it by using an internal clock. And unlike the normal flow-oriented event, the control event does not make its presence known by the arrival of data.
Structured Systems Analysis (4) • Examples • Customer places order. • Flow-oriented • Customer cancels order. • Flow-oriented • A daily report of all book orders is required at 9:00 AM. • Temporal • Invoices must be generated at 3:00 PM. • Temporal • Management reports must be generated once an hour. • Temporal • Book reprint order arrives at warehouse. • Control
Structured Systems Analysis (5) • Data Flow Diagrams • Context Diagram • The context diagram highlights several important characteristics of the system: • The people, organizations, or systems with which our system communicates. These are known as terminators or external entities. • The data that our system receives from the outside world and that must be processed in some way. • The data produced by our system and sent to the outside world. • The data stores that are shared between the system and the terminators. These data stores are either created outside the system and used by our system or created by our system and used outside the system. • The boundary between our system and the rest of the world. • Level 1 DFDs should be numbered as 1.0, 2.0, 3.0, and so on. • Level 2 DFDs should be numbered as 1.1, 1.2, 2.1, 2.2, 2.3, and so on.. • Level 3 DFDs (if necessary) should be numbered as 1.1.1, 1.1.2, 2.1.1, 2.1.2, and so on.
Structured Systems Analysis (6) • Data Dictionary • The data dictionary is an organized listing (usually alphabetically ordered) of all the data elements that are pertinent to the system, with precise, rigorous definitions so that both the user and the systems analyst will have a common understanding of all inputs, outputs, components of data stores, and intermediate calculations. • The data dictionary defines the data elements by doing the following: • Describing the meaning of the data flows and data stores shown in the DFDs. • Describing the composition of aggregate packets of data moving along the flows, that is, complex packets (such as a customer address) that can be broken into more elementary items (such as city, state, and postal code). • Describing the composition of packets of data in data stores. • Specifying the relevant values and units of elementary chunks of information in the data flows and data stores. • Describing the details of relationships between stores that are highlighted in an entity-relationship diagram.
Structured Systems Analysis (7) • Data Dictionary Notation = is composed of + and ( ) optional (may be present or absent) { } iteration [ ] select one of several alternative choices ** comment @ identified (key field) for a store | separates alternative choices in the [ ] construct
Structured Systems Analysis (8) • Data Dictionary Examples REFUNDS = {refund} refund = *information about a refund* @refund-date + @customer-ID + refund-amount refund-amount = *amount of money to be refunded to a customer* *units: dollars* refund-date = *the date the refund was approved* refund-response = *response to the customer who has asked for a refund* ["no such customer" | "no refund is due" + "current balance is" + current-balance | "refund approved"] current-balance = *amount of money currently owed by a customer,* *as of the current balance date* *units: dollars; range: 1-10,000*
Structured Systems Analysis (9) • Process Specification • The Process Specification (pspec or minispec) defines what must be done in order to transform inputs into outputs. It is a detailed description of the user's business policy that each bubble carries out. • Each bottom-level, primitive bubble in a data flow diagram should have a process specification. • There is a variety of tools that we can use to produce a pspec: structured English, decision tables, decision trees, pre/post conditions, flowcharts, Nassi-Shneiderman diagrams, and so on. While mots system analysts favor structured English, you should remember that any method can be used, as long as it satisfies two crucial requirements: • The pspec must be expressed in a form that can be verified by the user and the systems analyst. • The pspec must be expressed in a form that can be effectively communicated to the various audiences involved.
Structured Systems Analysis (10) PROCESS 2.8: Set New Credit Limit BEGIN find customer in CUSTOMERS with matching customer-ID IF record is not found credit-limit-response = "No such customer" ELSE read customer record IF new-credit-limit < 0 credit-limit-response = "illegal credit limit" display credit-limit-response ELSE credit-limit-response = "New credit limit is OK" display credit-limit-response replace credit-limit with new-credit-limit write customer record ENDIF ENDIF END
Structured Systems Analysis (11) • Entity-Relationship Diagrams • The Entity-Relationship Diagram (ERD) is a network model that describes the stored data layout of a system at a high level of abstraction. • The ERD consists of four major components: • Object types are shown by a rectangular box on the ERD. An object type represents a collection, or set, of objects (things) in the real world whose members play a role in the system being developed, can be identified uniquely, and can be described by one or more facts (attributes). • Relationships are shown by the diamond-shaped boxes on the diagram. A relationship represents a set of connections, or associations, between the object types connected by arrows to the relationship. • A special notation of the ERD is the associative object type indicator; this represents something that functions both as an object type and a relationship. Another way of thinking about the associative object type is that it represents a relationship about which we wish to maintain some information. • The subtype/supertype object types consist of an object type and one or more subcatergories, connected by a relationship.
Structured Systems Analysis (12) • Entity-relationship modeling - a semiformal data-oriented technique proposed by Peter Chen in 1976 • Database applications • Play an important role in object-oriented analysis • Examples • Figure 10.8 • Figure 10.9 • Figure 10.10 • EER diagram(Subclasses)
Structured Systems Analysis (13) • Finite State Machines • A FSM is a hypothetical machine that can be in only one of a given number of states at any specific time. In response to a an input, the machine generates an output and changes state. Both the output and the next state are purely functions of the current state and the input. • A finite state machine consists of five parts: • A finite, nonempty set of states J • A finite nonempty set of inputs K • The transition function T: (J - F) K J • The initial state S J • The set of final states F J • Extension - add a set of predicates P • The transition function T: (J - F) K P J • State transition diagram representation - Figure 10.11 • Tabular representation of a finite state machine - Figure 10.12
Structured Systems Analysis (14) • The Elevator Problem • Constraints • Each elevator has a set of m buttons, one for each floor. These illuminate when pressed and cause the elevator to visit the corresponding floor. The illumination is canceled when the corresponding floor is visited by the elevator. • Each floor, except the first floor and top floor, has two buttons, one to request an up-elevator and one to request a down-elevator. These buttons illuminate when pressed. The illumination is canceled when an elevator visits the floor and then moves in the desired direction. • When an elevator has no requests, it remains at its current floor with its door closed.
Structured Systems Analysis (15) Elevator Button EB(e, f) - the button in elevator e that is pressed to request floor f V(e,f): Elevator e is visiting (stopped at ) floor f (10.5) The STD for an elevator button - Figure 10.13 EBOFF(e,f) and EBP(e,f) and not V(e,f) -->EBON(e,f)
Structured Systems Analysis (16) • FB(d, f) - the button on floor f that requests an elevator traveling in direction d • S(d,e,f): Elevator e is visiting floor f and the direction in which it is about to move it either up(d=U), down (d=D), or no requests are pending(d=N) • The STD for a floor button - Figure 10.14 • FBOFF(d,f) and FBP(d, f) and not S(d, 1..n,f) --> FBON(d,f) • FBON(d,f) and EAF(1..n,f) and S(d, 1..n,f) -->FBOFF(d,f), d=U or D • The STD for the elevator - Figure 10.15