Download

1 / 6
60 likes | 203 Views
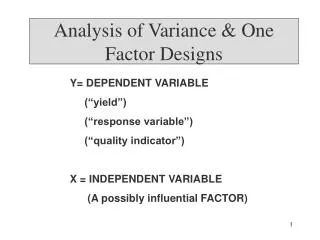
Single-Factor Analysis of Variance. Stat 701 Lecture Notes E. Pena. Illustrative Example #1.

E N D
Single-Factor Analysis of Variance Stat 701 Lecture Notes E. Pena
Illustrative Example #1 Growing interest in trout farming has prompted a number of experiments designed to compare various growing conditions. One factor of interest is the salinity of the water. The effect of salinity on the growth of rainbow trout (measured by increase in weight) was examined in the paper “Growth, Training and Swimming Ability of Young Trout Maintained under Different Salinity Conditions” (Journal of Marine Biological Association of UK, 1982, 699-708). Full strength seawater (32% salinity), brackish water (18% salinity), and fresh water (.5% salinity) were used. The following summary quantities were obtained. Question: Does the data provide sufficient evidence to conclude that the mean weight gain is not the same for the three salinity levels?
Illustrative Example #2 An individual’s critical flicker frequency (cff) is the highest frequency (in cps) at which the flicker in a flickering light source can be detected. At frequencies above the cff, the light source appears to be continuous even though it is actually flickering. An investigation carried out to see if true average cff depends on iris color yielded the following data. [Source: The Effect of Iris Color on Critical Flicker Frequency, J. of Gen. Psych., 1973, 91-95.] Question: Based on this data, what conclusions can be made regarding the relationship between the cff and iris color?
Single Factor ANOVA Model I: Assumptions Data Presentation Assumptions • error terms are uncorrelated. This is called the cell-means model. In this fixed effects model, interest is only on the chosen levels.
Estimation of Model Parameters Analysis of Variance Table