Download
1 / 56
590 likes | 702 Views
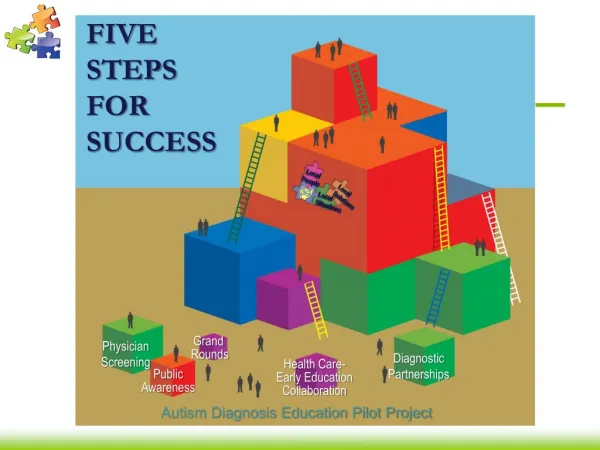
Five Steps for Structuring Data -Informed Conversations and Action in Education. October 1, 2014 Music City Center, Nashville, TN. Welcome and Overview. Lydotta Taylor, Ed.D. Research Alliance Lead, REL Appalachia. Agenda. Quick overview of REL program and REL Appalachia

E N D
Five Steps for Structuring Data-Informed Conversations and Action in Education October 1, 2014 Music City Center, Nashville, TN
Welcome and Overview Lydotta Taylor, Ed.D. Research Alliance Lead, REL Appalachia
Agenda Quick overview of REL program and REL Appalachia Local practitioner perspectives—Panel discussion Overview of Five Steps for Structuring Data-Informed Conversations and Action in Education Step 1—Setting the Stage; Activity Break Step 2—Examining the Data; Activity Lunch Step 3—Understanding Findings; Activity Sharing your district’s current data practices Expert feedback; Considerations for action Wrap-Up; Stakeholder Feedback Survey
Regional Educational Laboratory (REL) Program • U.S. Department of Education, Institute of Education Sciences. • RELs provide regional support for: • Applied research and evaluation. • Technical support and information sharing to build capacity to use data for improved education outcomes.
REL Appalachia’s Mission • Meet the applied research and technical support needs of Kentucky, Tennessee, Virginia, and West Virginia. • Bring evidence-based information to policymakers and practitioners: • Provide support for a more evidence-reliant education system. • Inform policy and practice for states, districts, schools, and other stakeholders. • Focus on high-priority, discrete issues and build a body of knowledge over time.
How We Work: Research Alliances • What is a research alliance? • A partnership between education stakeholders and REL Appalachia. • What is the purpose of a research alliance? • As partners, REL Appalachia and alliance members develop and carry out a research and analytic technical assistance agenda on priority topics. • Who are the education stakeholders in an alliance? • May include representatives from one or more schools, divisions, state education agencies, and other organizations (e.g., colleges and universities).
Goals of Today’s Bridge Event Understand the structure of an evidence-based data conversation. Understand how to examine data and findings. Understand a variety of practical strategies for having structured data conversations.
Local Practitioner PerspectivesPanel discussion Chris Causey, Ed.D. Supervisor of Accountability, Robertson County Mary Laurens Seely Data Coach Coordinator, Metropolitan Nashville Public Schools Vicky Smith, Ed.D. Regional Data Analyst, Mid-Cumberland CORE, TN Department of Education
Overview ofFive Steps for Structuring Data-Informed Conversations and Action in Education Shelby Maier, Ph.D. Systems Transformation Researcher, REL Pacific at McREL
About the Guide Initially created by REL Pacific as a technical assistance tool for research alliance members. Guidebook on how to bridge education data and practice. Applications of the guide are field-wide and have the potential to empower education stakeholders across the Pacific and beyond.
Background and Development of the Guide • Developed by REL Pacific in 2012/13. • Influenced by: • Using Data to Guide Action for School Improvement—guidebook released by the Nebraska Department of Education. • McREL’s The Power of Datahandbook. • Connections to: • The NCES Forum Guide to Taking Action. • The Pacific Comprehensive Center’s webinar series on data-driven decisionmaking.
Need for the Guide • Educators increasingly have access to more and more data. • We all use data to inform our decisionmaking. • Increasing availability due to No Child Left Behind, Race to the Top, other public policy—let’s leverage this power!
How the Guide Has Been Used • Trainings and workshops throughout the Pacific Region and beyond: • Data analysis trainings with the Palau Ministry of Education to understand how to examine questions of interest. • The Palau 20th Education Convention; tailored for classroom teachers. • College and career readiness trainings with the Commonwealth of the Northern Mariana Islands Public School System to understand, create, and examine college indicators.
Poll How often do you currently use data to guide your conversations and decisions?
Data Teams • Data teams … • Are groups of individuals with a common goalto use data to drive action and monitor performance. • Have a topic of interest that they are interested in exploring. • May include school administrators, teachers, analysts, parents, students, and other stakeholders from the community.
Data Teamsand Today’s Workshop • This workshop and the Five Steps guide capitalize on the collective input and wisdom of multiple perspectives. • Today we will work in groups of 4-5 people that will serve as examples of “data teams.” • Following this workshop, you may wish to convene a data team within your school system. • Teams can be formed by grade level, by subject, or around a topic of common interest. • Teams can be diverse. • School-, district-, and state-level personnel. • Policymakers, researchers, data managers. • Family and community members. • See what works for your school and for your topic.
Step 1. Setting the Stage What is the question? What information is needed to answer the question? What information is available to answer the question?
Step 1. Setting the Stage • What is the question? • Start by framing your question to answer “what” the issue is. • Four types of questions: • Description. “What percentage of my students are at or above proficiency in my quarterly math assessment?” • Relationship. “What is the relationship between students who participate in after-school tutoring and their math homework completion?” • Difference. “What is the difference between reading scores from quarter 1 and quarter 3 on my quarterly reading assessment?” • Prediction. “Do ACT scores predict GPA in college?”
Step 1. Setting the Stage • What is the question? • Start by framing your question to answer “what” the issue is. • Questions may start off as broad, but should eventually be narrowed, using the four elements of a research question.
Step 1. Setting the Stage “What do the data tell us about our middle school students’ math achievement level?” “What percentage of middle school students are achieving at or above proficiency on standardized math achievement tests in December 2013?” • What is the question?
Step 1. Setting the Stage Example: Standardized mathematics test scores for middle school students for December 2013 • What information is needed to answer the question? • Using the question that your data team has just defined, brainstorm what data are needed to answer it. • Consider whether the question requires data to be separated out for special groups of interest.
Step 1. Setting the Stage • What information is available to answer the question? • Previously analyzed data. • Raw or individual data. • Data collected at single points in time. • Data that can be combined to show how the same student, or groups of students, is performing over a period of time (i.e., longitudinal data).
Step 1 ActivityRecording Questions of Interest and Data Sources Chris Causey, Ed.D. Supervisor of Accountability, Robertson County Margie Johnson Business Intelligence Coordinator, Metropolitan Nashville Public Schools
Scenario Scenario: At the beginning of the year, Tennessee Comprehensive Assessment Program (TCAP) data were released. Last week, students took the Benchmark Assessment for monitoring student progress toward mastering Common Core State Standards.
Step 2. Examining the Data Looking for patterns and making observations. Exploring limitations of the data. Identifying key strengths and/or challenges.
Step 2. Examining the Data • Looking for patterns and making observations • Start with the “snapshot.” • Make sure your observations relate back to your question. • Observations can be made about strengths and challenges.
Step 2. Examining the Data • Exploring limitations of the data. • Comparing different sources of data. • Data that are not the same. • Rigorous analysis to draw causal conclusions. • Data that were not collected or stored in a way that allows for certain levels of analysis.
Step 2. Examining the Data • Identifying key strengths and/or challenges. • Done through observations that are specific, factual, and related to your question of interest.
Step 2 ActivityObservation Tracking; Strengths and Challenges Shannon Black Director of Talent Management, Metropolitan Nashville Public Schools Mary Laurens Seely Data Coach Coordinator, Metropolitan Nashville Public Schools
Examining the Data—Data Observations • Remember, JUST THE FACTS! • Avoid the following phrases: • Therefore… • Because… • It seems… • However…
Examining the Data—Strengths and Challenges What strengths and challenges arise from the data?
Step 3. Understanding Findings Choose a key challenge. Brainstorm possible factors. Identify key strengths and/or challenges.
Step 3. Understanding Findings • Choose a key challenge that is: • Actionable. • High priority.
Step 3. Understanding Findings • Brainstorm possible factors: • Consider possible causes of the challenge. • Stick to available facts. • Ask a series of “why” and “because” questions to get to possible causes of the challenge.
Step 3. Understanding Findings • Let’s look at some examples:
Step 3 ActivityIdentifying the Driving Factors Margie Johnson Business Intelligence Coordinator, Metropolitan Nashville Public Schools
Activity Facilitators Shannon Black, Director of Talent Management, MNPS Chris Causey, Ed.D., Supervisor of Accountability, Robertson County Mary Laurens Seely, Data Coach Coordinator, MNPS Vicki Smith, Ed.D., Regional Data Analyst, Mid-Cumberland CORE, TN DOE
Understanding Findings—Identifying Driving Factors Use the assigned protocol to brainstorm driving factors or causes. (Why?) Prioritize and circle 1‒3 contributing factors/causes that seem most plausible. Why? Because…