Download
1 / 69
700 likes | 847 Views
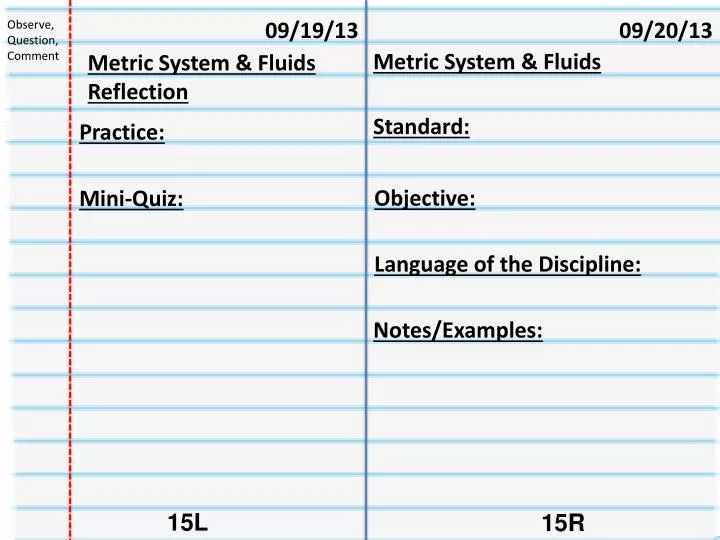
09/19/13. 09/20/13. Observe, Question, Comment . Metric System & Fluids. Metric System & Fluids Reflection. Standard:. Practice:. Objective:. Mini-Quiz:. Language of the Discipline:. Notes/Examples:. 15L. 15R. Practice. How many centimeters are in 11 meters?

E N D
09/19/13 09/20/13 Observe, Question, Comment Metric System & Fluids Metric System & Fluids Reflection Standard: Practice: Objective: Mini-Quiz: Language of the Discipline: Notes/Examples: 15L 15R
Practice • How many centimeters are in 11 meters? • How many millimeters are in 11 meters? • How many kilometers are in 11 meters? • How many decimeters are in 11 meters?
Metric Systems WorkMG 1.0 • 4 = 4 • 3 = 3 • 2 = 2 • 1 or below = 1
09/19/13 09/20/13 Observe, Question, Comment Metric System & Fluids Metric System & Fluids Reflection Standard: Practice: Objective: Warm-Up: Language of the Discipline: Gallon Man: Notes/Examples: 15L 15R
GallonBot WorkMG 1.0 • 11 – 10 = 4 • 9 – 8 = 3 • 7 – 6 = 2 • 5 or below = 1
Answer These Questions • 1) How many quarts are in 1 gallon? _____ • 2) How many pints are in 1 quart? _____ • 3) How many pints are in 1 gallon? _____ • 4) How many cups are in 1 pint? _____ • 5) How many cups are in 1 quart? _____ • 6) How many cups are in 1 gallon? _____ • 7) Draw Mr. Gallon Man from memory
Stem-and-Leaf Plotand Central Tendency By: Mr. Menjivar
09/23/13 09/24/13 Observe, Question, Comment Mean, Median, and Mode Stem and Leaf Plot Mean, Median, and Mode Stem and Leaf Plot Reflection Standard: 16L 16R
CA Content Standards Statistics Data Analysis and Probability 1.1: Know various forms of display for data sets Statistics Data Analysis and Probability 1.3: Understanding the meaning of, and be able to compute, the median of a data set
09/23/13 09/24/13 Observe, Question, Comment Mean, Median, and Mode Stem and Leaf Plot Mean, Median, and Mode Stem and Leaf Plot Reflection Standard: Objective: 16L 16R
Objective: • To find the mean, median, mode and range of a set of data • To make stem-and-leaf plots
09/23/13 09/24/13 Observe, Question, Comment Mean, Median, and Mode Stem and Leaf Plot Mean, Median, and Mode Stem and Leaf Plot Reflection Standard: Objective: Language of the Discipline: 16L 16R
The BASICSYou Must Memorize • Mean = • Median = Middle of the data set • Mode = Value that repeats the most • Range = Highest Value — Lowest Value
Vocabulary:Stem-and-Leaf Plot The graph displays numerical data arrange in order. Each data item is broken into a stem and a leaf.
09/23/13 09/24/13 Observe, Question, Comment Mean, Median, and Mode Stem and Leaf Plot Mean, Median, and Mode Stem and Leaf Plot Reflection Standard: Practice: Objective: Language of the Discipline: Notes/Examples: 16L 16R
Example!!… Let’s take a look at these students that did a Readathon at their school. Find the • Mean • Median • Mode • Range
09/23/13 09/24/13 Observe, Question, Comment Mean, Median, and Mode Stem and Leaf Plot Mean, Median, and Mode Stem and Leaf Plot Reflection Standard: Practice: Objective: Warm-Up: Language of the Discipline: Notes/Examples: 16L 16R
Warm-Up Find the Median of each data set • 12, 10, 11, 7, 9, 8, 10, 5 • 55, 53, 67, 52, 50, 49, 51, 52, 52, 52 • 101, 100, 100, 105, 102, 101
Find the Median of each data set • Median is 9.5 • Median is 52 • Median is 101
You Do!!… Let’s take a look at these T-shirt prices that have different colors. Find the • Mean • Median • Mode • Range
You Do!!… Let’s take a look at these T-shirt prices that have different colors. Find the • Mean is $24.40 • Median is $26 • Mode (there is no mode) • Range is $8
Example 1Making Stem-and-Leaf Plots Make a stem-and-leaf plot for the data 51, 56, 67, 44, 50, 63, 65, 58, 49, 51, 66, 59, 63, 47 Step 1: Choose the stems. • What is the least value? • What is the greatest value? • What are the stems?
Example1[continued…] Step 2: Draw the stem-and-leaf plot
Example 2 Below are the monthly high temperatures for Death Valley California. Make a stem-and-leaf plot for the data. 87, 91, 101, 111, 120, 125, 134, 126, 120, 113, 97, 86
Independent Practice Make a stem-and-leaf plot of each data set. • 54, 48, 52, 53, 67, 61, 68, 49, 40, 50, 69, 73, 74, 76, 78 • 124, 129, 131, 116, 138, 107, 105, 116, 122, 137, 138, 134
09/26/13 09/27/13 Observe, Question, Comment Box and Whiskers Plot Box and Whiskers Plot Reflection Warm-Up: 17L 17R
09/26/13 09/27/13 Observe, Question, Comment Box and Whiskers Plot Box and Whiskers Plot Reflection Standards: Warm-Up: 17L 17R
CA Content Standards Statistics Data Analysis and Probability 1.1: Know various forms of display for data sets Statistics Data Analysis and Probability 1.3: Understanding the meaning of, and be able to compute, the median of a data set
09/26/13 09/27/13 Observe, Question, Comment Box and Whiskers Plot Box and Whiskers Plot Reflection Standards: Warm-Up: Objective: 17L 17R
Objective: • To make box-and-whisker plots • To analyze data in box-and-whisker plots
09/26/13 09/27/13 Observe, Question, Comment Box and Whiskers Plot Box and Whiskers Plot Reflection Standards: Warm-Up: Objective: Language of the Discipline: 17L 17R
Vocabulary:Box-and-Whisker Plot The graph displays the distribution of data items along a number line
Vocabulary:Quartiles They divide the data into four equal parts. (Note: the median is the middle quartile)
09/26/13 09/27/13 Observe, Question, Comment Box and Whiskers Plot Box and Whiskers Plot Reflection Standards: Warm-Up: Objective: Practice: Language of the Discipline: Notes/Examples: 17L 17R
Box-and-Whisker Plot Summary • Minimum means Lowest Value • Lower Quartile means median of lower half • Median • Upper Quartile means median of upper half • Maximum means Greatest Value
First • Put the data in order from least to greatest • Find the median • Find the median of the lower half which is the lower quartile (LQ). • Find the median of the upper half which is the upper quartile (UQ).
Second • Graph the median on the number line. • Graph the quartiles on the number line. • Graph the minimum and maximum.(biggest and smallest value.)
Third • Draw a box around the quartiles • Draw a vertical line at the median.
Fourth • Draw a line from the quartiles to the minimum and maximum
Example 1 • Draw a box-and-whisker plot for the distances of migration of birds. (thousands of miles) 5, 2.5, 6, 8, 9, 2, 1, 4, 6.5, 18, 7
Example 2 • The data below represent the wingspans in centimeters of captured birds. Make a box-and-whiskers plot. 61, 35, 61, 22, 33, 29, 40, 62, 21, 49, 72, 75, 28, 21, 54
Example 3 • Make a box-and-whiskers plot. 1, 1, 3, 3, 4, 5, 7, 7, 8, 9, 9.