Download

1 / 19
190 likes | 286 Views
Stream-Based Electricity Load Forecast. Authors: Joao Gama Pedro Pereira Rodrigues. Presented by: Viktor Botev. Problem area. Sensor data received at high speed Dynamic and non-stationary environment Companies buy and cell energy based on load profiles and forecasts

E N D
Stream-Based Electricity Load Forecast Authors: Joao Gama Pedro Pereira Rodrigues Presented by: Viktor Botev
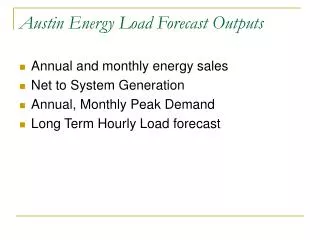
Problem area • Sensor data received at high speed • Dynamic and non-stationary environment • Companies buy and cell energy based on load profiles and forecasts • Load forecast in SCADA/DMS system help find critical points
Existing methods • Forecasting using Adaptive neural networks (ANN) • Static iteration training for ANN is not applicable for high speed data • Predictive systems over thousands of sensor
Solution presented • Incremental Clustering (Variable Clustering) • Incremental Learning of ANN • Other techniques for preprocessing and postprocessing • Data aggregation engine • Kalman Filter
Technical goal • Incremental system to continuously predict in real time the electricity load demand • At time t: • receive data from all sensors • predict the sensor value of each sensor for time t+k • back propagate the measurement corresponding to the prediction at t-k
Preprocessing • Server based approach for: • Gathering data from sensors • Aggregation • Synchronization < date, time, sensor,measure, value >
Clustering of Data Streams • Using ODAC algorithm (Online Divisive-Agglomerative Clustering) • based on dissimilarities between streams • Similarity equation • Pearson’s correlation coefficient • Guarantees • Hoeffding bounds
Clustering of Data Streams • Building a clustering hierarchy • Measures taken for relax the assumption that ” In a hierarchical structure of clusters, considering that the data streams are produced by a stable concept, the intra-cluster dissimilarity should decrease with each split”
MLP ANN predictive model • Time horizons • 1 hour • 24 hours • 168 hours • Muti-layered perceptron • 10 input neurons • 4 hidden neurons • 1 linear output • Input vector • {1, 2, 3, 4} • {7, 14} • 4 cyclic variables (sin + cos)
MLP ANN predictive modelHow it works? • Read Buffer (size is defined by experts) • Structure – input into buffer, real value and old prediction comparison, input the ANN, store predictions, delete from buffer
MLP ANN problems and solutions • Slow learning rate • Propagating an example only once • Overfitting • Dual perturb and combine algorithm • Processing one example several times • Adding noise to the examples • Avaraging all the predictions produced (Pesonal opinion is that the main reason for dealing with overfitting is convincing the companies)
Improving predictions • Kalman Filter • Simple one dimensional Kalman Filter • Using for combining inexact measurement with inexact predictions • Common technique is when at time t to predict value at time t-k
Online learning and preprocessing • Missing data • Accomodate homologue technique • Problems • When sensors do not send data for a long time • Consequences • Overfitting • Concept damaging
Evaluation and results • Test setup • 2500 sensors • 565 High Tension • 1629 Mean Tension • 299 Power Transformers • Measure of interest • Current intensity • Data • Gathered data for 3 years in an hourly bases • Quality measures of the forecasts • MAPE (Mean Absolute Percentage Error) • MEDAPE (Median Absolute Percentage Error) • Windows used • Weekly • Monthly
Summary • We have discussed a system that can deal with large number of sensor data and predict their values within a given time horizon • The predictive model discussed eliminates the need for batch clustering and periodic ANN training • Future work could be adding more information in the model as temperature, holiday, and special events.