Download
1 / 15
150 likes | 277 Views
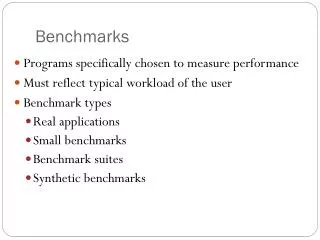
Historical Benchmarks. HRT 383 Lunch & Dinner Fall 2008. What is a benchmark?. From Merriam-Webster Online: A point of reference from which measurements may be made http://www.m-w.com/cgi-bin/dictionary Accessed 10/08/04. An Historical Benchmark is…. An historical point of reference

E N D
Historical Benchmarks HRT 383 Lunch & Dinner Fall 2008
What is a benchmark? • From Merriam-Webster Online: A point of reference from which measurements may be made http://www.m-w.com/cgi-bin/dictionary Accessed 10/08/04
An Historical Benchmark is… • An historical point of reference • What did we do in the past? • Measurable • Dollars/Cents • Percentage • Count • Time • Weight • Volume
Cautions: • Compare “Apples to Apples” • Watch for differences in: • Volume • Days or Day-Part Variations • Number of operation periods • Hours of operation • Seasonality • “Like Items” • Menu prices • A La Carte vs. Banquets
Searching for Benchmarks… • Net Sales Analysis: • Daily or weekly sales in dollars • Total sales • Food sales • Beer sales • Wine sales • Bar sales • Daily or weekly guest count • Daily or weekly check average
Searching for Benchmarks… • Weekly Menu Mix/Sales History Analysis: • Item sales (by count or percentage) • Individual items (count or percent) • Category sales (count or percentage) • A la carte counts vs. banquet counts • Unless most other measures are equal (or close to equal), use percentages for benchmarks!
Searching for Benchmarks… • Bar Cost: • Daily or weekly percentages • Beer costs percentage • Wine cost percentage • Total bar percentage • Usually, weekly information is more accurate than daily information
Searching for Benchmarks… • Credits to Cost of Goods Sold: • Comps vs. Total Sales • Goodwill comps (marketing) vs. QSA • Waste report • Accuracy is critical • Use for information rather than benchmarks • Family meal issues
Searching for Benchmarks… • Weekly Summary: • QTD information • Counts • Check average • Sales • COGS • Quarterly food cost percentage • Weekly and quarterly bar cost percentage • Other expense categories by percentage
Searching for Benchmarks… • QTD Menu Mix/Sales History Analysis: • Item sales (by count or percentage) • Individual items (count or percent) • Category sales (count or percentage) • A la carte counts vs. banquet counts • Usually QTD information is used for benchmark percentages
Searching for Benchmarks… • Budgets: • Total Sales • COGS • Food cost percentage target is 33% • Food Cost Marketing & Training is 17% • Bar cost percentage target is 40%
Searching for Benchmarks… • Lunch Menu Mix – Spring 2008: $15.22 Ave. Check • Appetizers 73.9% • Manager’s Special App 53%% • #1-Selling Menu Entrée – Ravioli 4.9% • Halibut 4.8% • Fish Tacos 4.3% • Manager’s Special Entrée 52.9% • A la carte to banquet = 64.3% / 35.7% • Desserts = 73.1% • Manager’s Special Dessert 51.2% • Beverages = 91.4%
Weekly Bar Sales 250 5.7% Food sales 4,125 94.3% Total Sales 4,375 Daily Bar Sales 63 4.6% Food sales 1,031 95.4% Total Sales 1,094 70 Covers/day @ $15.- Lunch Projection UPDATE
Searching for Benchmarks… • Dinner Menu Mix – Spring 2008: • $30.70 Ave. Check • #1-Ribeye 18.0% • #2-Scampi 14.4% • #3-Pork14.1% • #4-Lamb 11.1% • A la carte to banquet 71.7 / 28.3% • Beverages 90.3% • Bottled Wine 251 each • WBTG 502 each
Weekly Bar Sales 714 15% Food sales 4,286 85% Total Sales 5,000 Daily Bar Sales 238 15% Food sales 1,429 85% Total Sales 1,667 50 Covers/day @ $35.- Dinner Projection Revisit