Download
1 / 12
120 likes | 213 Views
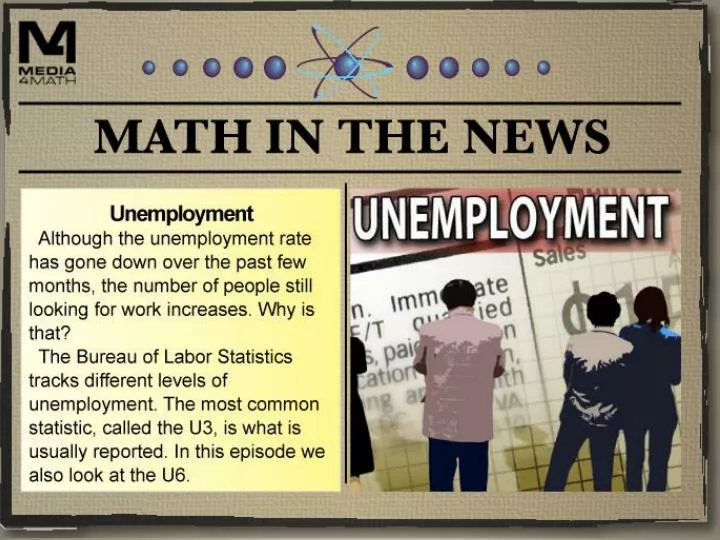
Unemployment. The U3 tracks people out of work who are actively looking for work. Those who have stopped looking for work are not counted in the U3. The monthly unemployment numbers reported are the U3 stats. U-3

E N D
Unemployment The U3 tracks people out of work who are actively looking for work. Those who have stopped looking for work are not counted in the U3. The monthly unemployment numbers reported are the U3 stats. U-3 Total unemployed, as a percent of the civilian labor force (official unemployment rate)
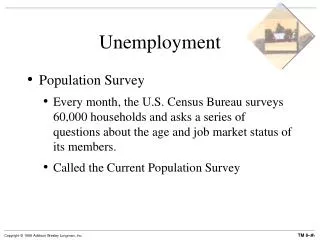
Unemployment The U6 captures all people who are capable of working, whether they are looking for work or not. Retired people are not counted in this statistic. U-6 Total unemployed, plus all persons marginally attached to the labor force, plus total employed part time for economic reasons, as a percent of the civilian labor force plus all persons marginally attached to the labor force
Unemployment We can look at the Labor Force as made up of those who are Employed, those who are Unemployed Looking for Work (U3), and Unemployed and Not Actively Seeking Work (U6).
Unemployment The Unemployment Rate (U3) can go down when people get jobs and are Employed.
Unemployment The Unemployment Rate (U3) can also go down when people stop looking for work.
Let’s compare the U3 and U6 statistics over a period of time.
Unemployment This table shows the U3 and U6 unemployment rates for a five-month period. Source: Bureau of Labor Statistics.
Unemployment This is the graph of the data from the table.
Unemployment Both the U3 and U6 rates show some modest decreases, but how is the overall number of people in the workforce changing?
Unemployment This table shows that as the Unemployment Rate (U3) has gone down, the total number not in the Labor Force has gone up.
While the Unemployment Rate (U3) has gone down, this has been due in part to people no longer looking for work.