Download
1 / 69
710 likes | 958 Views
Water Pollution. The Seattle, Washington Area, U.S. Fig. 20-1, p. 528. Core Case Study: Lake Washington. Sewage dumped into Lake Washington 1955: Edmondson discovered cyanobacteria in the lake Role of phosphorus – nutrient allowing the bacteria to grow.

E N D
The Seattle, Washington Area, U.S. Fig. 20-1, p. 528
Core Case Study: Lake Washington • Sewage dumped into Lake Washington • 1955: Edmondson discovered cyanobacteria in the lake • Role of phosphorus – nutrient allowing the bacteria to grow. • Public pressure led to cleanup of the lake • Sewage treatment plant effluent diverted to Puget Sound • Population growth bringing new challenges
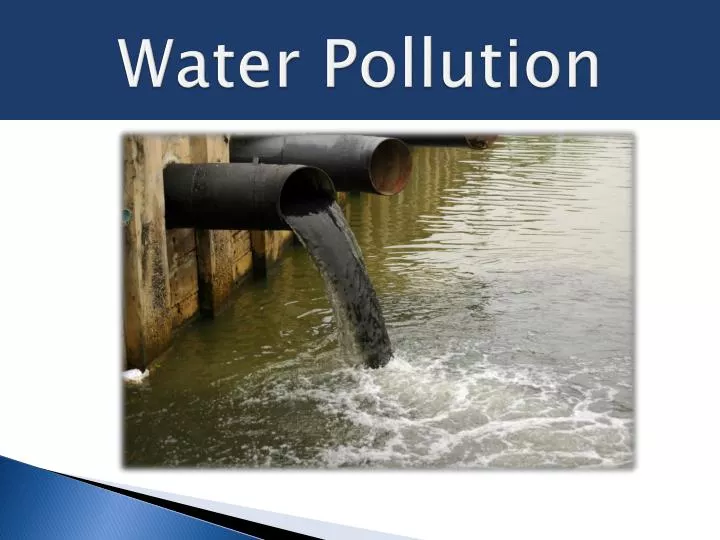
Water Pollution Comes from Point and Nonpoint Sources (1) • Water pollution • Change in water quality that can harm organisms or make water unfit for human uses • Usually caused by • Contamination by chemicals • Excessive heat • Point sources • Located at specific places • Easy to identify, monitor, and regulate • Examples • Drain pipe, sewer line, etc.
Point Source of Polluted Water in Gargas, France Fig. 20-3, p. 530
Water Pollution Comes from Point and Nonpoint Sources (2) • Nonpoint sources • Broad, diffuse areas • Difficult to identify and control • Expensive to clean up • Examples • Runoff from farms, feedlots, urban streets, etc.
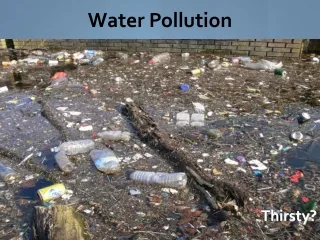
Water Pollution Comes from Point and Nonpoint Sources (3) • Leading causes of water pollution • Agriculture activities • Sediment eroded from the lands • Fertilizers and pesticides • Bacteria from livestock and food processing wastes • Industrial facilities • Growing problem with coal ash (an indestructible waste) • Mining • Erosion of sediment • Runoff of toxic chemicals • Human consumption • plastics
Nonpoint Sediment from Unprotected Farmland Flows into Streams Fig. 20-4, p. 530
Lake Polluted with Mining Wastes Fig. 20-5, p. 531
Plastic Wastes in Mountain Lake Fig. 20-6, p. 531
Major Water Pollutants Have Harmful Effects • Infectious disease organisms: contaminated drinking water • The World Health Organization (WHO) • 1.6 million people die every year, mostly under the age of 5 • Not enough clean drinking water or enough water for adequate hygiene. • Diarrhea – kills a child under 5 every 18 seconds
Major Water Pollutants and Their Sources Table 20-1, p. 532
Common Diseases Transmitted to Humans through Contaminated Drinking Water Table 20-2, p. 532
Science Focus: Testing Water for Pollutants (1) • Variety of tests to determine water quality • Coliform bacteria: Escherichia coli, significant levels • Safe levels: • Drinking: no e. coli/100 ml • Swimming: less than 200 colonies of e.coli/100 ml • Level of dissolved oxygen (DO) • Chemical analysis
Science Focus: Testing Water for Pollutants (2) • Indicator species • Examples • Bacteria and yeast glow in the presence of a particular toxic chemical • Color and turbidity of the water
Water Quality as Measured by Dissolved Oxygen Content in Parts per Million Fig. 20-A, p. 533
Streams Can Cleanse Themselves If We Do Not Overload Them • Clean themselves of degradable, oxygen-demanding wastes through • Dilution • Biodegradation of wastes by bacteria takes time • Process interrupted by: • Overloading with pollutants • Drought • Damming • Water diversion • Does not remove slowly degrading or nondegradable wastes • Oxygen sag curve • The reduction of organisms with high oxygen demand until cleansed.
Dilution and Decay of Degradable, Oxygen-Demanding Wastes in a Stream Fig. 20-7, p. 534
Stream Pollution in More Developed Countries • 1970s: Water pollution control laws • Industries reduce or eliminate point source wastes • Successful water clean-up stories • Ohio Cuyahoga River, U.S. • So polluted-it would catch on fire • Thames River, Great Britain • Flowing sewer • Contamination of toxic inorganic and organic chemicals by industries and mines
Individuals Matter: The Man Who Planted Trees to Restore a Stream • John Beal: restoration of Hamm Creek, Seattle, WA, U.S. • 1980- stream had no fish and all trees gone due to pollution • Planted trees • Persuaded companies to stop dumping • Removed garbage
Global Outlook: Stream Pollution in Developing Countries • Half of the world’s 500 major rivers are polluted • Most run through less developed countries • Can not afford waste treatment plants • No laws for controlling pollution • According to Global Water Policy Project – 80-90% of developing countries dump untreated sewage directly into surface waters • Untreated sewage • Industrial waste • India’s rivers • 2/3 of water resources of polluted • China’s rivers • 2007 Report – 1.3 billion live without treated water
Natural Capital Degradation: Highly Polluted River in China Fig. 20-8, p. 535
Trash Truck Disposing of Garbage into a River in Peru Fig. 20-9, p. 536
Too Little Mixing and Low Water Flow Makes Lakes Vulnerable to Water Pollution • Less effective at diluting pollutants than streams • Stratified layers • Little vertical mixing • Little of no water flow • Can take up to 100 years to change the water in a lake • Biological magnification of pollutants
Lake Fish Killed by Water Pollution Fig. 20-10, p. 536
Cultural Eutrophication Is Too Much of a Good Thing (1) • Eutrophication • Natural enrichment of a shallow lake, estuary, or slow-moving stream • Caused by runoff into lake that contains nitrates and phosphates • Oligotrophic lake • Low nutrients, clear water
Cultural Eutrophication Is Too Much of a Good Thing (2) • Cultural eutrophication • Nitrates and phosphates from human sources • Farms, feedlots, streets, parking lots • Fertilized lawns, mining sites, sewage plants • During hot weather or droughts • Algal blooms • Increased bacteria • More nutrients • Anaerobic bacteria
Cultural Eutrophication of Chinese Lake Fig. 20-11, p. 537
Cultural Eutrophication Is Too Much of a Good Thing (3) • Prevent or reduce cultural eutrophication • Remove nitrates and phosphates (expensive) • Banning or limiting use of nitrates/phosphates, etc. • Soil conservation • Clean up lakes • Remove excess weeds • Use herbicides and algaecides • Pump in air (expensive, energy intensive)
Revisiting Lake Washington and Puget Sound • Severe water pollution can be reversed • Citizen action combined with scientific research • Good solutions may not work forever • Wastewater treatment plant effluents sent into Puget Sound • Now what’s happening? • Need to reduce pop growth and resource use • Healthy Puget Sound by 2020.
The Great Lakes of North America Fig. 20-12, p. 538
Case Study: Pollution in the Great Lakes (1) • 95% of US & 1/5 of World’s fresh surface water. • 1960s: Many areas with cultural eutrophication • Especially lake Erie • 1972: Canada and the United States: Great Lakes pollution control program (Great Lakes Water Quality Agreement) • Decreased algal blooms • Increased dissolved oxygen • Increased fishing catches • Swimming beaches reopened • Better sewage treatment plants • Fewer industrial wastes • Bans on phosphate-containing household products
Case Study: Pollution in the Great Lakes (2) • Problems still exist • Raw sewage • Nonpoint runoff of pesticides and fertilizers • Biological pollution (invasive species) • Atmospheric deposition of pesticides and Hg • 2007 State of the Great Lakes report • New pollutants found • Wetland loss and degradation • Declining of some native species • Native carnivorous fish species declining
Ground Water Cannot Cleanse Itself Very Well (1) • Source of drinking water • Common pollutants • Fertilizers and pesticides • Gasoline • Organic solvents • Pollutants dispersed in a widening plume (diffusion)
Ground Water Cannot Cleanse Itself Very Well (2) • Slower chemical reactions in groundwater due to • Slow flow: contaminants not diluted • Less dissolved oxygen • Fewer decomposing bacteria • Low temperatures
Polluted air Hazardous waste injection well Pesticides and fertilizers Coal strip mine runoff Deicing road salt Buried gasoline and solvent tanks Cesspool, septic tank Pumping well Gasoline station Water pumping well Waste lagoon Sewer Landfill Leakage from faulty casing Accidental spills Discharge Freshwater aquifer Freshwater aquifer Freshwater aquifer Groundwater flow Fig. 20-13, p. 540
Groundwater Pollution Is a Serious Hidden Threat in Some Areas • China: 90% of urban aquifers are contaminated or overexploited • U.S.: FDA reports of toxins found in many aquifers • Threats • Gasoline, oil • Nitrate ions • Arsenic
Pollution Prevention Is the Only Effective Way to Protect Groundwater • 1000s of years for contaminated ground water to cleanse itself of degradable pollution. • Nondegradable stay forever. • Prevent contamination of groundwater • Cleanup: expensive and time consuming
Solutions Groundwater Pollution Prevention Cleanup Find substitutes for toxic chemicals Pump to surface, clean, and return to aquifer (very expensive) Keep toxic chemicals out of the environment Install monitoring wells near landfills and underground tanks Inject microorganisms to clean up contamination (less expensive but still costly) Require leak detectors on underground tanks Ban hazardous waste disposal in landfills and injection wells Store harmful liquids in aboveground tanks with leak detection and collection systems Pump nanoparticles of inorganic compounds to remove pollutants (still being developed) Fig. 20-14, p. 541
There Are Many Ways to Purify Drinking Water • Reservoirs and purification plants • Process sewer water to drinking water • Expose clear plastic containers to sunlight (UV) • Less developed countries • The LifeStraw • Inexpensive, portable water filter • Aid agencies distribute in Africa • PUR: chlorine and iron sulfate powder
The LifeStraw: Personal Water Purification Device Fig. 20-15, p. 542
Case Study: Protecting Watersheds Instead of Building Water Purification Plants • New York City water • Reservoirs in the Catskill Mountains • Paid towns, farmers, and others in the watershed to restore forests, wetlands, and streams • Saved the cost of building a plant: $6 billion
Using Laws to Protect Drinking Water Quality • 1974: U.S. Safe Drinking Water Act • Sets maximum contaminant levels for any pollutants that affect human health • Health scientists: strengthen the law • Water-polluting companies: weaken the law
Case Study: Is Bottled Water the Answer? • U.S.: some of the cleanest drinking water • Bottled water • Some from tap water • 40% bacterial contamination • Fuel cost to manufacture the plastic bottles • Recycling of the plastic • 240-10,000x the cost of tap water • Growing back-to-the-tap movement
Ocean Pollution Is a Growing and Poorly Understood Problem (1) • 2006: State of the Marine Environment • 80% of marine pollution originates on land • Sewage • Coastal areas most affected • Deeper ocean waters • Dilution • Dispersion • Degradation
Ocean Pollution Is a Growing and Poorly Understood Problem (2) • Cruise line pollution: what is being dumped? • U.S. coastal waters • Raw sewage • Sewage and agricultural runoff: NO3- and PO43- • Harmful algal blooms • Oxygen-depleted zones • Huge mass of plastic in North Pacific Ocean • Great Pacific Garbage Patch
Industry Nitrogen oxides from autos and smokestacks, toxic chemicals, and heavy metals in effluents flow into bays and estuaries. Cities Toxic metals and oil from streets and parking lots pollute waters; sewage adds nitrogen and phosphorus. Urban sprawl Bacteria and viruses from sewers and septic tanks contaminate shellfish beds and close beaches; runoff of fertilizer from lawns adds nitrogen and phosphorus. Construction sites Sediments are washed into waterways, choking fish and plants, clouding waters, and blocking sunlight. Farms Runoff of pesticides, manure, and fertilizers adds toxins and excess nitrogen and phosphorus. Red tides Excess nitrogen causes explosive growth of toxic microscopic algae, poisoning fish and marine mammals. Closed shellfish beds Closed beach Oxygen-depleted zone Toxic sediments Chemicals and toxic metals contaminate shellfish beds, kill spawning fish, and accumulate in the tissues of bottom feeders. Oxygen-depleted zone Sedimentation and algae overgrowth reduce sunlight, kill beneficial sea grasses, use up oxygen, and degrade habitat. Healthy zone Clear, oxygen-rich waters promote growth of plankton and sea grasses, and support fish. Fig. 20-16, p. 545
Science Focus: Oxygen Depletion in the Northern Gulf Of Mexico • Severe cultural eutrophication • Oxygen-depleted zone • Overfertilized coastal area • Preventive measures • Will it reach a tipping point?
A Large Zone of Oxygen-Depleted Water in the Gulf of Mexico Due to Algal Blooms Fig. 20-B, p. 546
Ocean Pollution from Oil (1) • Crude (oil from ground) and refined petroleum (processed petroleum products) • Highly disruptive pollutants • Largest source of ocean oil pollution • Urban and industrial runoff from land • 1989: Exxon Valdez, oil tanker • 2010: BP explosion in the Gulf of Mexico