Download
1 / 29
300 likes | 485 Views
Part II: Probabilistic Modeling of IUdR Incorporation and Cell Cycle Dynamics . Studies to determine if IUdR has an impact upon cell cycle progression as it is incorporated into DNA in mismatch repair (MMR) competent or deficient cells:.

E N D
Part II: Probabilistic Modeling of IUdR Incorporation and Cell Cycle Dynamics
Studies to determine if IUdR has an impact upon cell cycle progression as it is incorporated into DNA in mismatch repair (MMR)competent or deficient cells: Experimental Design: Synchronization of HCT116 vector and HCT116 MLH1-transfected cells for cell cycle and IUdR incorporation studies. • Plated 5x10^6 HCT116 vector and HCT116 MLH1-transfected cells in separate flasks,grew to confluence, then serum-starved with 0.1% fetal calf serum/DMEM medium for 60 hours to arrest cells in G0. • Trypsinized and counted cells, and plated 3x10^6 cells into plates containing either 10% dialyzed serum/DMEM or 10mM IUdR with 10% dialyzed serum/DMEM to release cells from G0 arrest, one plate for each timepoint. Synchronization was confirmed by taking one sample of each line for cell cycle analysis. • Once cells started moving into S phase (around 10 to 12 hours post release), plates were harvested every hour. • Timepoints taken every hour from 10 to 24 hours post release. Harvest one nontreated and treated plate for each cell line per hour, hours 10 through 24 post-release, half of each plate for cell cycle studies, the other half for IUdR incorporation studies.
Studies to determine if mismatch repair (MMR) status has an impact upon cell cycle progression as IUdR is incorporated into DNA: Synchronized non-treated MMR proficient and deficient cells show different cell cycle profiles. MLH1 deficient cells move into S phase sooner, and have a slightly lessened S phase (arrow 1) and a greatly lessened G2 peak (arrow 2) compared to MLH1 proficient cells. Apparently the presence of MLH1 impacts the cell cycle profiles even in the absence of drug. This might raise a question if a sense/repair of endogenous replication errors by the MMR systems alters the cell cycle progression.
The IUdR treament may affect the S-phase progression in the MMR+ cells while it results in G2- and G1- checkpoints response in the MMR- cells. A C B The distribution in the cell cycle was quantitated using the ModFit® software program. The MMR+ cells seemed to have a slower S-phase progression with the IUdR treatment as compared to the control (the 1st cycle of S-phase, arrow A). However, no substantial differences were found in the G1 and G2 populations. In contrast, the MMR- cells showed G1 and G2 checkpoints responses following the IUdR incorporation in the S-phase, presumably due to unrepaired IUdR incorporation (arrow B and C). Note that no alteration was found in the 1st S-phase with IUdR in the MMR- cells.
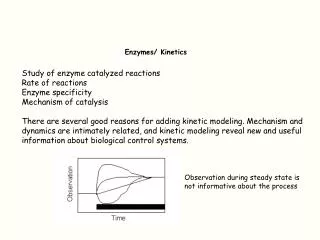
Probabilistic Model of Cell Cycle • The distribution of cells in the cell cycle is modeled as a finite state automaton representing the states of a cell cycle on a per cell basis. • The jumps between states are modeled using continuous probability distributions to account for the time spent (sojourn time) in each state. • The population behavior is modeled as the aggregation of the individual cell models. • The models for both deficient and proficient cells without and with treatment are developed.
M PG2-M(t3|t2) PM-G1(t4|t3) G2 G1 S PS-G2(t2|t1) PG1-S(t1|t0) Probabilistic Model of Cell Cycle PX-Y(tj|ti): Probability density function of the jump from state X to state Y at time tj assuming that the jump to state X occurred at ti
Probabilistic Model of Cell Cycle • Synchronized cells: All start in G1 (both experimentally and in the model) • The probability of being in state G1 at a given time T for the first cell cycle after the cells are released from the state G0 is given by:
Probabilistic Model of Cell Cycle • In the first cell cycle, the probability for the cell to be in S phase at time T is given by: • The probability for the cell to be in state G2 at time T is given by:
Probabilistic Model of Cell Cycle • The probabilities for the second cycle are given by:
Probabilistic Model of Cell Cycle • The experimental data provided information on two cell cycles • In the model, the distribution of the cells in different cell cycle states is calculated for these two cycles • Total probabilities for being in each cell cycle state are calculated as the sum of the probabilities for the first and second cycles:
Probabilistic Model of Cell Cycle • The probabilities D, E and F are doubled when computing the total probabilities to take into account the doubling of the cells after one cycle. • The percentages in each cell cycle are then calculated as:
Probabilistic Model of Cell Cycle • The model parameters are tuned using the experimental cell cycle distribution time course data for both deficient and proficient cells with and without treatment by IUdR. • The cell cycle model together with the models for IUdR incorporation can then be used to predict cell cycle distribution as well as the IUdR incorporation at a given point of time.
Parameters for HCT116 • Without treatment G1: m1 = 11.15982276077897 v1 = 11.15982276077897 S: m2 = 11.41110059539757 v2 = 4.71755119479214 G2: m3 = 4.03204728035603 v3 = 1.10140340921382 • With treatment G1: m1 = 10.49261748647168 v1 = 8.51426094690137 S: m2 = 9.98454716793465 v2 = 3.19173594960439 G2: m3 = 4.97935604609361 v3 = 1.69936970688222
Parameters for HCT116+chr3 • Without treatment G1: m1 = 14.75016904874924 v1 = 6.53296066979688 S: m2 = 8.41730602081550 v2 = 2.55750964881533 G2: m3 = 5.38086779753963 v3 = 1.10619496588187 • With treatment G1: m1 = 15.78223340974096 v1 = 5.07483324653527 S: m2 = 7.30987931213704 v2 = 1.77087309396636 G2: m3 = 5.14307027238457 v3 = 1.01503842642855
IUdR Incorporation Model • The model used here is a linear regression model: y = Xβ + ε • where: • y is an n-by-1 vector of responses (% IUdR incorporation) • X is an n-by-p matrix of predictors (Distribution of cells in each cell cycle state ) • β is an p-by-1 vector of parameters (Model output) • ε is an n-by-1 vector of random disturbances
IUdR Incorporation Models • There are two sets of measurements for IUdR incorporation. • We have used the first set to generate the model. • We have used the second set to verify the model by calculating the squared error between the model output and the second set of measurements for IUdR incorporation. Error = (Data Set 2 – Model Output )^2
The Model for HCT116 Vector • The model for this case is given by: y = 374.3040 - 3.5176*G1 - 3.5254*S -3.4934*G2 • Here: G1, S and G2 are the percentage of cells in these cell cycle states, respectively • The model p-value = 0.0125 (p<0.05) is significant showing a linear model is a good fit for the data. • The squared error for the second set is small showing that the model is a good fit for the validation data set.
The Model for HCT116 MLH1 transfected • The model for this case is given by: y = -1396.6 + 14.1362*G1 + 14.1748*S + 14.2049*G2 • Here: G1, S and G2 are the percentage of cells in these cell cycle states, respectively • The model p-value = 0.0001 (p<0.05) is significant showing a linear model is a good fit for the data. • The squared error for the second set is small showing that the model is a good fit for the validation data set.
IUdR Incorporation Prediction • It is shown that the IUdR incorporation over time can be modeled using a regression model with the distribution of cells in each cell cycle state as independent variables. • The cell cycle model provides a prediction of the distribution of cells in each state. The output of the cell cycle model will be used together with the IUdR incorporation model to predict the IUdR incorporation at a given instant of time. • The models will also be used to classify the cells with unknown MMR profiles to determine whether they are proficient or deficient.