Download
1 / 27
270 likes | 384 Views
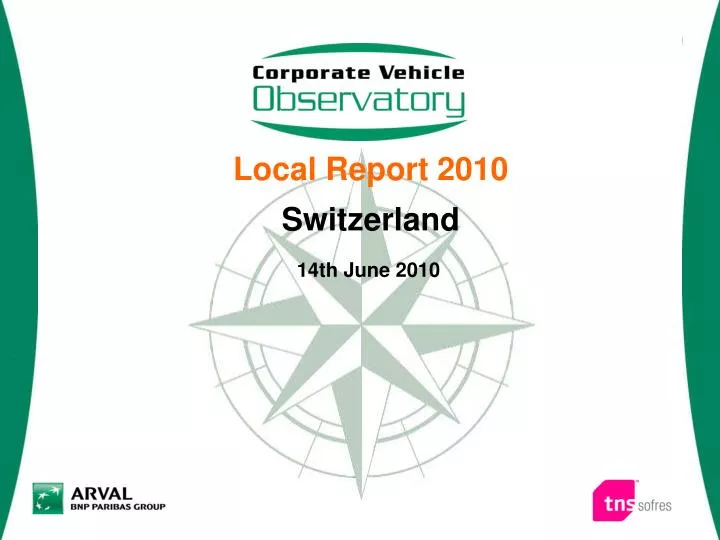
Local Report 2010 Switzerland. 14th June 2010. Design of the study. EUROPE. 14 countries covered by the study in 2010 including 2 new members : Brazil & Turkey. Methodology. Global Sample. Sample: 3316 interviews through Europe: Covering all company sizes

E N D
Local Report 2010 Switzerland 14th June 2010
EUROPE 14 countries covered by the study in 2010 including 2 new members : Brazil & Turkey
Methodology Global Sample • Sample: 3316 interviews through Europe: • Covering all company sizes • Including 1552 interviews of Large Companies • Target: Companies of all industries using corporate vehicles • Fieldwork period: From January 2010 to February 2010 • Data collection method: Per telephone Local Sample : 4 segments Companies with Less than 10 employees Companies with 10 to 99 employees Companies with 100 to 499 employees Companies with 500 employees and + 97 67 89 60
* Local sample Distribution of companies in the country * Base: companies with corporate vehicles * Source: National Institutes of Statistics / Eurostat – private sector ** Unweighted figures. The distribution of companies interviewed has been reweighted according to its real structure at the local level.
Comparison with EUROPE Fleet growth potential in the next 3 years BALANCE 2010 BALANCE 2009 Decrease Increase -0.8% -0.8% 26 26 Balance = Fleet growth will increase – Fleet growth will decrease Base: companies with corporate vehicles = 100%
Comparison with EUROPE Distribution of the fleet • Transport vehicles: of less than 3,5 tons • Service vehicles: used for maintenance and repair of facilities, general services, after-sales services… • Sales vehicles: intended for sales travel and appointments • Incentive vehicles: made available to employees as part of the company’s compensation policy • Vehicles in exchange of a monthly cost: deduced from the employee’s salary Base: companies with corporate vehicles = 100% Total can be different from 100% due to DK
+ EUROPE + Average duration of usage of the fleet Light commercial vehicles and Personal Cars Comparison with Average duration of usage in months Light Commercial Vehicles Personal Cars
+ + Answers to the crisis Comparison with EUROPE % who introduced the measure as an answer to the crisis Base: companies with corporate vehicles = 100%
Main financing method Consolidated results – Comparison with EUROPE Self-purchase = outright purchase + credit (other than car credit) Don’t know & others excluded Self-purchase = outright purchase + credit (other than car credit) Don’t know & others excluded Data have been consolidated: 3 years average for France, Germany, Italy, Portugal, Switzerland, Poland, Belgium and Czech Republic, Spain and India 2 years average for UK and Greece 1 year only for Brazil and Turkey Base: companies with corporate vehicles = 100%
Comparison with EUROPE Global fleet growth potential in the next 3 years according to main financing method BALANCE Decrease Increase Self purchase Car credit Financial leasing Operating leasing Balance = Fleet growth will increase – Fleet growth will decrease Base: companies with corporate vehicles = 100%
Impact of the crisis on the vehicle policy In 2010 – Per company size Due to the crisis, the vehicle policy... GLOBAL 2010 22% 13% 63% 0% GLOBAL 2009 6% 2% 22% 66% Base: companies with corporate vehicles = 100% Total can be different from 100% due to DK
Users liberty of choosing a vehicle Comparison with EUROPE % of companies in which most of usershave to choose… Freely within a given budget In a limited list No personal choice Base: companies with corporate vehicles = 100% Total can be different from 100% due to DK
Choice criteria when adding new vehicles to the fleet Comparison with EUROPE % who quote as most important criteria Total Don‘t know / no answer Their total cost of usage Their monthly leasing Their net purchase price Base: companies with corporate vehicles = 100% Total can be different from 100% due to DK
Perceived evolution of average duration since last year Comparison with EUROPE % who say that the average duration of Personal cars has… Total Increased Decreased Base: companies with Personal cars/Excluding second-hand vehicles
Answers to the crisis Comparison with EUROPE % who introduced the measure as an answer to the crisis Total Base: companies with corporate vehicles = 100%
Use of green vehicles By company size - 2010 % At least one of these green vehicles Base: companies with corporate vehicles = 100%
Main barriers for taking a green vehicle Comparison with EUROPE % who quote each barrier for a specific vehicle Hybrid Base: companies with more than 10 employees, with corporate vehicles, and not intending to use green vehicles in the next 3 years
Main barriers for taking a green vehicle Comparison with EUROPE % who quote each barrier for a specific vehicle Hybrid Base: companies with more than 10 employees, with corporate vehicles, and not intending to use green vehicles in the next 3 years
+ + Evolution of the budget allocated to the company vehicles Comparison with EUROPE % who reduced the budget allocated to company vehicles due to the crisis Yes, from 0 to 10% Yes, more than 10% of budget Total Changes 26% 40% 18% 33% No changes Total can be different from 100% due to DK Base: companies with corporate vehicles = 100%
+ + Interest for additional services Comparison with EUROPE % of interest for the following services Very interested Rather Interested XX% ST Interested Base: companies with corporate vehicles = 100%
PC and LCV Registrations Switzerland Source: ACEA