Download
1 / 13
130 likes | 219 Views
HQ01e protection heater tests. Summary Aug 02, 2012 T. Salmi. HQ PH. Outer layer (OL). Inner layer (IL). Trace Stainless steel: 25.4 μm (1 mil), Kapton: 25.4 μm (with glue ~45 μm ). PH study overview. P rocedure I mag constant 1 PH strip fired

E N D
HQ01e protection heater tests Summary Aug 02, 2012 T. Salmi
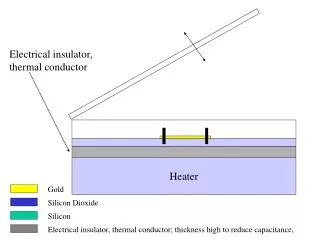
HQ PH Outer layer (OL) Inner layer (IL) Trace Stainless steel: 25.4 μm (1 mil), Kapton: 25.4 μm (with glue ~45 μm)
PH study overview • Procedure • Imag constant • 1 PH strip fired • Delay to quench onset measured Parameters • Temperature [K]: 4.4, 1.9 • Imag[kA]: 5, 8, 11, 14 • IL, OL (Coil 9) VPH≈ 230 V Pw0 ≈ 50 W/cm2 (OL) Pw0 ≈ 50 W/cm2 (IL) τ = RC ≈ 40 ms Voltagetapsignal Voltage Quench detected Time PHdelay
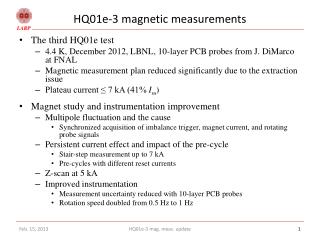
HQ01e: PH delays • PH delay scales with Iss • Almost independent of temperature • OL quench faster than IL • EXCEPTION: 4.4 K &14 kA: IL quench faster (but slower propagation) Inner layer Outer layer HQ01e: 25.4 μm Kapton HQ01e at CERN: Pw0 = 50 W/cm2, tau 40 ms: Iss = 17.3 kA @ 4.4 K; 19.1 kA @ 1.9 K
HQ01e vs. HQM01 and HQM04:Outer layer VPH = 230 V • HQ01e: 25.4 μm Kapton • HQM01: 50.8 μmKapton (+ 100 %) PHdelay + 20 to 50 % • HQM04: 76.2 μm Kapton (+ 200 %) PH delay + 60 to 150 % • Note: In HQM01 and HQM04 this is a typical result using tau = 46 ms. Using tau = 23 ms, if Imag = 5 kA, thequench in HQM04 is faster than inHQM01. HQM04 HQM01 HQ01e HQ01e at CERN: Pw0 = 50 W/cm2, tau 40 ms: Iss = 17.3 kA @ 4.4 K; 19.1 kA @ 1.9 K HQM04 at FNAL: Pw0 = 45 W/cm2, tau 46 ms: Iss = 16.2 kA @ 4.6 K; 18.2 kA @ 2.2 K HQM01 at FNAL: Pw0 = 47 W/cm2, tau 46 ms: Iss = 17.0 kA @ 4.6 K
HQ01e vs. HQM04: Inner layer VPH = 230 V • NO difference for Imag < 12 kA! • Imag> 12 kA: Longer delay in HQM04 • Superfluid • Cooling for coil • Contact with coil HQM04 HQ01e: 25.4 μm Kapton HQM04: 76.2 μmKapton HQ01e HQ01e at CERN: Pw0 = 55 W/cm2, tau 40 ms: Iss = 17.3 kA @ 4.4 K; 19.1 kA @ 1.9 K HQM04 at FNAL: Pw0 = 49 W/cm2, tau 46 ms: Iss = 16.2 kA @ 4.6 K; 18.2 kA @ 2.2 K
Summary • HQ01e: 25.4 μm Kapton between SS and coil • HQ01e: PH delays measured using VPH = 230 V, Pw0 = 50 W/cm2, tau = 40 ms • PH delays at 81 % of Iss: 7ms (OL) and 6 ms (IL) (+/- 1 ms) • PH delay seems almost independent of operating temperature • Imag <= 12 kA: IL quench slower than OL • Imag = 14 kA: IL quench faster • Need more data at high current to confirm • Comparison with coils tested in the mirror structure: HQM01: + 100 % Kapton (50.8 μm) OL: PH delay +20 … 50 % (IL not tested in HQM01) HQM04: + 200 % Kapton (76.2 μm) OL: PH delay +60 … 150 % (OL) IL: No difference for Imag < 12 kA
PH delay definition – HQ01e Example: 11 kA – fired 9B02 – 4.4 K (qhi10) Quench onset At 11 kA and 14 kA quench signals are quite clear. Quench onset defined when a segment voltage starts the rise to quench.
The distances between the taps (mm) Outer layer Inner layer HQ voltage tap locations
9A02 – 4.4. K – 14 kA 9A05-04 quenches (higher field). In other IL tests, 9A04-03 quench (More turns covered by PH).
9B02 – 4.4. K – 14 kA 9B04-05 quenches (typical). Slower first quench onset, but faster quench detection than in IL.