Download
1 / 21
210 likes | 345 Views
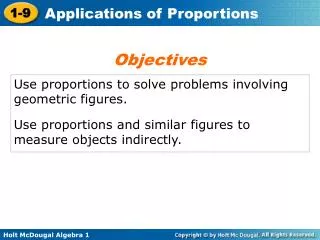
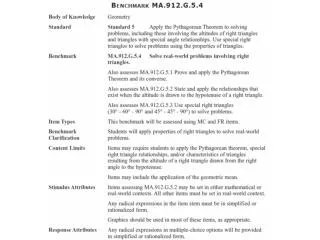
MA.7.A.1.3 Solve problems involving similar figures. Block 28.

E N D
Similarity is the basis of all measurement. It reveals the secret of map making and scale drawings. Similarity helps explain why a hummingbird's heart beats so much faster than a human heart, and why it is impossible for a small creature such as a praying mantis to become as large as a horse.
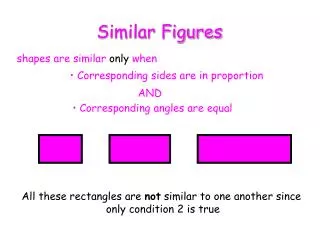
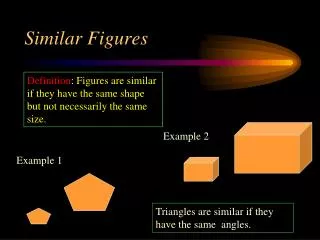
Vocabulary • Similar figures • Corresponding sides • Corresponding angles • Scale factor • Double, twice, triple, half
Do we really understand the definition of similarity? Activity 1 Completing the enlargement
Distribute a copy of the worksheet “Complete Enlargement” to each participant • Participants are asked to complete the enlargement of a heptagon
Discussion after activity • What were you trying to accomplish as you made the enlargement? • What was your method to finish the enlargement? • What changed in the enlarged figured? What stayed the same? • What was the scale factor? • How could this activity be used in the classroom? • Do students need to have a formal understanding of similarity before engaging in this activity?
Proportional and Non-proportional relationships Activity 2 Similarity Problems
Proportional relationships • Are linear, but not all linear relationships are proportional • Are multiplicative • Y-intercept is zero • Have a constant of proportionality (k) y=k*x
Linear (or directly) Proportional Relationships • Major topic in elementary mathematics education • Basic model for advance problems in pure and applied mathematics • Students tend to believe that every numerical relationship is linear (known in math education as linear misconception or linear obstacle) • Students over-generalize the linear model
Research on properties of similar figures • Gaining insight into the relationships between lengths, areas and volumes of similar figures is usually a slow and difficult process. (Cognitive difficulty: high) • “… most students in grades 5–8 incorrectly believe that if the sides of a figure are doubled to produce a similar figure, the area and volume also will be doubled” (NCTM, 1989, pp. 114–115). • Using realistic mathematics, this misunderstanding can easily be overcome.
GeoGebra: Perimeter_area_similar Open the GeoGebra file As you change the scale factor, notice the changes in Fig B The point “Perimeter” moves in the coordinate system as the scale factor changes, what path does it describe? Check the box perimeter to verify your conjecture as you change the scale factor Is the relationship linear (proportional)? If yes, what is the equation of the line? What does the slope represent? Do the same for the point “Area”
How can we help students understand that not all problems are linear? • Does the shape of the figure used in the problem matter? • Does the presence (or absence) of a drawing help students? With the following activity we will explore some of these answers.
Activity • Will use applied mathematics problems dealing with lengths and areas of two similar geometric figures • Divide participants in 3 groups • Give a worksheet to each participants • Participants should work individually • Group 1 is not suppose to do any drawings, only calculations in order to solve the problems • Group 2 must make a sketch or drawing before solving the problem • Group 3 already has a correct drawing in each problem.
Discussion after problems were done • Did all problems follow the linear model? • What problems were easier? • Do you think that problems were easier to solve for a particular group? Why? • Do you think that a sketch or drawing has a beneficial effect on the students’ performance? • Does it help more if students do the drawing or if it is provided in the problem? • Are problems more difficult for different types of plane figures? • Does the shape of the figure matter?
Students make their own Drawings • They must construct a proper (mental) representation of the essential elements and relations involved in the problem. Can all students do that? • Especially for the non-linear problems, this representational activity should help students to detect the inappropriateness of a stereotyped linear proportional reasoning, and to determine the nature of the non-linear relationship connecting the known and the unknown elements in this problem.
Giving Students the Correct Drawing • Students may not succeed in making a correct, usable drawing themselves. • Giving students a correct ready-made drawing, could be more effective than instructing them to generate such a drawing on their own, especially for students with learning disabilities • Is giving a correct drawing more effective for all students? • Does making your own drawing reinforces comprehension of the problem? Does it help understand what they are reading?
Does the shape of the figure matter in the difficulty of the problem? • Does it matter for linear and/or non-linear problems? • What strategies can students use to find the solution to these non-linear problems? • How can the drawings help?
In the problem with squares, students could choose among three appropriate solution strategies: • ‘paving’ the big square with little ones (2) calculating and comparing the areas of both figures by means of the area formula (3) applying the general principle ‘if length is increased by r, then area is increased by r2’.
Strategies for the problems with circles • The first solution strategy becomes impossible • The second strategy is more error-prone (because of the greater complexity of the formula for finding the area of a circle) • The last strategy is the best • In problems with circles, does a drawing help?
Strategies for problems with irregular shapes • Can only be solved by applying the general principle (the third solution strategy). • How can we help students understand the general principle?
A study using 12-13 year old students concluded that: • Most students were able to solve the proportional items correctly, whereas the non-proportional items were seldom solved correctly. • Drawings, either student made or given, does not increase students’ performance. • The type of figure used in the problem has a significant effect on the percentage of correct responses.