Download
1 / 37
370 likes | 445 Views
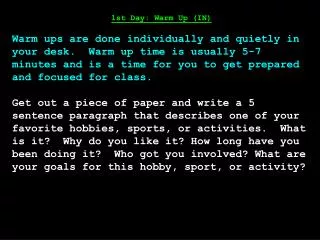
Copy the entire question AND answer choices on page 8 of your interactive notebook. Then circle the correct answer!. Bio Warm up 09/03. Which of the following safety practices prevents damage to a microscope? A swinging the microscope from the arm

E N D
Copy the entire question AND answer choices on page 8 of your interactive notebook. Then circle the correct answer! Bio Warm up 09/03 Which of the following safety practices prevents damage to a microscope? Aswinging the microscope from the arm B storing the microscope with the high power objective in place C leaving the lamp on for the next class D using lens paper to clean the objective lenses
What Is The Scientific Method? • Organized series of steps • Used to solve problems • 6 main steps! (sometimes 5 steps, depending on who you are) • Scientists use many approaches to solve a problem, but all use these MAIN steps at some point!
Why Do We Need A Method? • To stay organized and not repeat mistakes • So that other scientists can replicate the experiment with similar results • To add to your amount of evidence • Help prevent speculation
Science Begins with OBSERVATIONS **Try an exercise in observation. How good are your observing skills?
The Big Problemo… • STEP 1 !! • Identify a question you want to answer! What do you want to figure out…
Research… • Step 2 !! • Gather any and all information on your problem’s topic! • Use the internet, library, journals, specialists, etc… just make sure it is valid evidence!!
Hypothesis…(Not Hypotenuse!!) • Step 3 !! • Form an educated guess that provides a possible answer to the problem statement. “If…then…” format should always be used!
Examples… • If cat food is fed to a dog twice a day, then it will turn into a cat in one week. • If one teaspoon of salt is added to a goldfish bowl weekly, then in ten weeks the fish will be able to survive in the Atlantic Ocean.
Experiment…(The Fun Part!) • Step 4 !! • Perform the actual procedures used to support or reject a hypothesis. • Can have several parts to it. • Can use many different materials and pieces of equipment.
Data…Lots of Data… • Step 5 !! • Collect and record information and results from the experiment. • Graphs & tables used commonly • Pie, bar, & line graphs
Data = information gathered from observations Quantitative = a quantity, a number or measure Qualitative = a quality, description
Conclusion… • Step 6 !! • Written response using the results of the experiment. • Supports or rejects the hypothesis.
What If I Was Wrong?? • It’s ok to be wrong! • Try again! • Tweak factors in your experiment! • No experiment is a bad experiment!! • YOU CAN LEARN FROM EVERYTHING!
Copy the entire question AND answer choices on page 10 of your interactive notebook. Then circle the correct answer! Bio Warm up 09/04 An example of a quantitative data is the A month of birth Bhighest educational degree earned Ctime taken to complete a reasoning task D telephone area code
Independent (Manipulated) Variable • The item being tested or changed… • There should be only 1 independent variable!
Dependent (Responding) Variable • Change that occurs due to the procedures performed on the independent variable. • Independent Controls Dependent!!
Control… • Must be present to make an experiment valid!! • Used for a comparison! • Part not tested, it is original, not altered! CONTROL
Theory… • A well-supported hypothesis that unifies a broad range of observations • Enables scientists to accurately predict what will happen in new situations
Law… • Concise statement that expresses a fundamental principle of science • Differs from theory because it doesn’t speculate; it’s just the results of repeated observations
Why is graphing important? • Most scientific data is presented as a graph!!!
What are the three main types of graphs used??? • Line Graph • Bar Graph • Pie Graph
Bar Graphs • These are graphs with rectangular bars, with different lengths, that are proportional to the value they represent. • Bar charts are used for comparing two or more values.
Pie Graphs • These are circular charts, divided into sections, that illustrate the relative magnitudes, percents, or frequencies. • Together, the sections create a full disk (360 degrees)
Line Graphs • Line graphs are the most useful type of graph for representing and interpreting data • This type of graph shows how one variable is changed by another
The Rules • Which variable goes where???? DRY MIX!! • Dependent (responding) variable – The variable that depends on the independent variable. This goes on the y-axis!! • Independent (manipulated) variable – The variable we are manipulating. This goes on the x-axis!!!
Required Labels Title– Should be in the form of, “The dependence of [dependent variable] on [independent variable]” Y axis label, be sure to indicate units of measurement X axis label, be sure to indicate units of measurement * Make sure that your scale on both the x and y axes are consistent and reasonable
How to draw a line graph… • The data in the graph should fill the page • Use a ruler!!!! • Graphs should always be shown as smooth lines or curves (aka TRENDLINE) • Never connect the dots with straight lines to form a saw-tooth pattern
Smooth lines???? • Why? • The data we take is not perfect. We are looking for overall trends, not individual data points!!!!! • What do abrupt changes in a graph tell you? • Obvious discontinuities suggest a significant change has taken place. If possible this measurement needs to be repeated!
Direct Relationships • In a direct relationship, as one variable increase/decreases, the other variable also increases/decreases • Direct relationships graph as a straight line
Inverse Relationships • In an inverse relationship, as one variable increases, the other decreases • Inverse relationships graph as hyperbolas
Types of Investigations • Descriptive • Comparative • Experimental
DESCRIPTIVE Descriptive research is based mainly on observations. Examples of descriptive research are… 1. Making models 2. Dissections 3. Observing animals in the wild For example, how do the survivors of a disaster react to the disaster? * No variables; data is based on watching and talking to survivors
COMPARATIVE Comparative Research involve collecting and comparing data of different organisms, objects, features, or conditions related to science. For Example, comparing the growth of two plants-one with fertilizer, one without.
EXPERIMENTAL Experimental Research involves designing a fair test (using controls) in which the variables are manipulated, or changed and measured in an effort to gather evidence to support or not support the hypothesis.