Download
1 / 15
150 likes | 260 Views
Synthesized CMAQ A BRAVO community Product. Address Questions to Bret Schichtel Schichtel@cira.colostate.edu. Biases in Modeled Source Attribution Estimates. July. October. REMSAD Monthly Source Attribution Results. July - Underestimated at all sites – Mexican influence in west TX

E N D
Synthesized CMAQA BRAVO community Product Address Questions to Bret Schichtel Schichtel@cira.colostate.edu
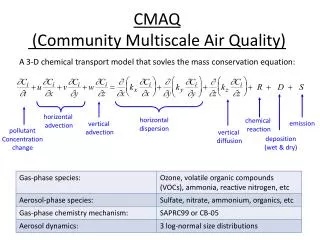
Biases in Modeled Source Attribution Estimates July October REMSAD Monthly Source Attribution Results • July - Underestimated at all sites – Mexican influence in west TX • October - Overestimated at all sites – Eastern US influence • Jul – Aug: underestimated in west TX close agreement in East (compensating errors) NOTE: CMAQ has similar but less severe biases
Synthesis Inversion – Removing Source Attribution Biases Each source region is multiplied by a source attribution scaling coefficient aj to account for biases in emission, kinetics and/or transport for each source region. SO4 (Predicted)i,l = a1*(Mexico) i,l + a2*(Texas)i,l + a3*(E US)i,l + a4*(W US)i,l + a5*(Boundary Conditions)i,l aj = 1 if CMAQ “perfectly” fits the observed values in a least squares sense The relationship is inverted to find aj which are then used to adjust the source attribution estimates
Bayesian Least Squares • Incorporate prior estimates of the regression coefficients and their variance. • J(a) = Sjk (yi – S Giu au) Xjk (yk – S Gkv av) +S(au – zu) Wuv (av-zv) Minimize square residuals Minimize squared difference between prior and post estimates Minimize J(a) to find the unknown scaling coefficient a z: the prior estimates of the source attribution scaling coefficients W: the variance of the prior estimates
Application of Bayesian Least Squares to Synthesized CMAQ • Prior estimates of scaling coefficients z = 1 (perfect model) • Variance of priors (diagonals of W) = 1 (model is good within a factor of 2) • All 5 coefficients were free to vary
Which BRAVO Sites to Include? Exploring the spatial variability in source attribution scaling coeff. • The synthesis inversion was applied to each monitoring site using the daily data in three time periods to derive spatially varying but temporally constant coefficients for each time period. • Time periods with upon unique transport flow directions: • 7/9 – 8/5: Transport primarily from Mexico, and southeast TX • 8/6 – 9/19: Transport primarily from Mexico, east Texas and Eastern US • 9/20 – 10/28: Transport could be from any direction • The Bayesian least square regression was used for each monitoring site and time range.
Which BRAVO Sites to Include? • t-test was used to determine how different the coefficients were from the coefficients at Big Bend • All sites with t > 3 for a given source region which contributed 10% or more was deemed to be significantly different from Big Bend
Synthesized CMAQ – Temporally Varying Coefficients – Optimum Results Daily scaling coefficients were derived by incorporating data from all sites that were not significantly different from Big Bend for a given time period Three consecutive days were incorporated into each inversion with the coefficients applied to the middle day. Performance Stats
Synthesized CMAQ – Average % Contribution During BRAVO Percentages in () are the original CMAQ results
Synthesized CMAQ – % Contribution for Each BRAVO Sulfate Episode
Synthesized REMSAD Results • Identical process was used on the REMSAD source attribution estimates. • Notables: • the 4 eastern US source regions were combined into one source region • Prior variances for source regions in: • Mexico and Eastern US = 4 • Texas = 2 • Western US and BC = 0.5
Average Source Contribution to Big Bend’s Sulfate from 7/9 – 10/28/1999
Synthesized CMAQ – The Ultimate BRAVO Data Integration Research Collaboration Effort • Inputs from all three air quality models • Measured data from BRAVO, IMPROVE and CASTNet monitoring networks • Incorporation of source oriented and receptor oriented modeling concepts - Hybrid modeling • Incorporates Inputs from all research groups involved in BRAVO