Download
1 / 87
1.07k likes | 2.08k Views
Factorial Experiments: - Blocking, -Confounding, and -Fractional Factorial Designs. Emanuel Msemo. Wednesday, July 30, 2014 4:30pm – 6:30 pm 1020 Torgersen Hall. ABOUT THE INSTRUCTOR. Graduate student in Virginia Tech Department of Statistics. B.A. ECONOMICS AND STATISTICS

E N D
Factorial Experiments: -Blocking, -Confounding, and -Fractional Factorial Designs. Emanuel Msemo Wednesday, July 30, 2014 4:30pm – 6:30 pm 1020 Torgersen Hall
ABOUT THE INSTRUCTOR Graduate student in Virginia Tech Department of Statistics • B.A. ECONOMICS AND STATISTICS • (UDSM,TANZANIA) • MSc. STATISTICS (VT,USA) • LEAD/ASSOCIATE COLLABORATOR IN LISA “If your experiment needs a statistician, you need a better experiment.” Ernest Rutherford
MORE ABOUT LISA www.lisa.vt.edu • What? • Laboratory for Interdisciplinary Statistical Analysis • Why? • Mission: to provide statistical advice, analysis, and education to Virginia Tech researchers • How? • Collaboration requests, Walk-in Consulting, Short Courses • Where? • Walk-in Consulting in GLC and various other locations • Collaboration meetings typically held in Sandy 312 • Who? • Graduate students and faculty members in VT statistics department
HOW TO SUBMIT A COLLABORATION REQUEST • Go to www.lisa.stat.vt.edu • Click link for “Collaboration Request Form” • Sign into the website using VT PID and password • Enter your information (email, college, etc.) • Describe your project (project title, research goals, specific research questions, if you have already collected data, special requests, etc.) • Contact assigned LISA collaborators as soon as possible to schedule a meeting
LISA helps VT researchers benefit from the use ofStatistics Collaboration: Visit our website to request personalized statistical advice and assistance with: Experimental Design • Data Analysis • Interpreting ResultsGrant Proposals • Software (R, SAS, JMP, SPSS...) LISA statistical collaborators aim to explain concepts in ways useful for your research. Great advice right now: Meet with LISA before collecting your data. Short Courses:Designed to help graduate students apply statistics in their research Walk-In Consulting: M-F 1-3 PM GLC Video Conference Room; 11 AM-1 PM Old Security Building Room 103 For questions requiring <30 mins All services are FREE for VT researchers. We assist with research—not class projects or homework.
COURSE CONTENTS: 1. INTRODUCTION TO DESIGN AND ANALYSIS OF EXPERIMENTS 1.1 Introduction 1.2 Basic Principles 1.3 Some standard experimental designs designs 2. INTRODUCTION TO FACTORIAL DESIGNS 2.1 Basic Definitions and Principles 2.2 The advantage of factorials 2.3 The two-Factor factorial designs 2.4 The general factorial designs 2.5 Blocking in a factorial designs
3. THE 2K FACTORIAL DESIGNS 3.1 Introduction 3.2 The 22 and 23 designs and the General 2k designs 3.3 A single replicate of the 2k designs 4. BLOCKING AND CONFOUNDING IN THE 2K FACTORIAL DESIGNS 4.1 Introduction 4.2 Blocking a replicated 2k factorial design. 4.3 Confounding in the 2k factorial designs. 5. TWO LEVEL FRACTIONAL FACTORIAL DESIGNS 5.1 Why do we need fractional factorial designs? 5.2 The one-half Fraction of the 2k factorial design 5.3The one-quarter Fraction of the 2k factorial design
INTRODUCTION TO DESIGN AND ANALYSIS OF EXPERIMENTS Questions: What is the main purpose of running an experiment ? What do one hope to be able to show? Typically, an experiment may be run for one or more of the following reasons: 1. To determine the principal causes of variation in a measured response 2. To find conditions that give rise to a maximum or minimum response 3. To compare the response achieved at different settings of controllable variables 4. To obtain a mathematical model in order to predict future responses
An Experiment involves the manipulation of one • or more variables by an experimenter in order to • determine the effects of this manipulation • on another variable. • Much research departs from this pattern in that nature rather than • the experimenter manipulates the variables. Such research is • referred to as Observational studies • This course is concerned with COMPARATIVE • EXPERIMENTS • These allows conclusions to be drawn about cause • and effect (Causal relationships)
Sources of Variation • A source of variation is anything that could • cause an observation to be different from • another observation Independent Variables • The variable that is under the control of the • experimenter. • The terms independent variables, treatments, • experimental conditions, controllable variables • can be used interchangeably
Dependent variable • The dependent variable (response) reflects • any effects associated with manipulation • of the independent variable Now Sources of Variation are of two types: • Those that can be controlled and are of • interest are called treatments or treatment • factors • Those that are not of interest but are • difficult to control are nuisance factors
Uncontrollable factors Z1 Z2 ZP ……. PROCESS INPUTS OUTPUT (Response) ……. X1 X2 XP Controllable factors Adapted from Montgomery (2013) The primary goal of an experiment is to determine the amount of variation caused by the treatment factors in the presence of other sources of variation
The objective of the experiment may include the following; • Determine which conditions are most influential on the response • Determine where to set the influential conditions so that the • response is always near the desired nominal value • Determine where to set the influential conditions so that variability • in the response is small • Determine where to set the influential conditions so that the effects • of the uncontrollable Variables are minimized
EXAMPLE; Researchers were interested to see the food consumption of albino rats when exposed to microwave radiation “If albino rats are subjected to microwave radiation, then their food consumption will decrease”
TRY! Independent variable? ………………………. Dependant variable? ………………………. Nuisance factor (s)? ……………………….
BASIC PRINCIPLES The three basic principles of experimental designs are; • Randomization • The allocation of experimental material and the order in • which the individual runs of the experiment are to be • performed are randomly determined • Replication • Independent repeat run of each factor combination • Number of Experimental Units to which a treatment • is assigned
Blocking • A block is a set of experimental units sharing a • common characteristics thought to affect the • response, and to which a separate random • assignment is made • Blocking is used to reduce or eliminate the • variability transmitted from a nuisance factor
SOME STANDARD EXPERIMENTAL DESIGNS The term experimental design refers to a plan of assigning experimental conditions to subjects and the statistical analysis associated with the plan. OR An experimental design is a rule that determines the assignment of the experimental units to the treatments.
Some standard designs that are used frequently includes; Completely Randomized design A completely randomized design (CRD) refer to a design in which the experimenter assigns the EU’s to the treatments completely at random, subject only to the number of observations to be taken on each treatment. The model is of the form; Response = constant + effect of a treatment + error
Block designs This is a design in which experimenter partitions the EU’s in blocks, determines the allocation of treatments to blocks, and assigns the EU’s within each block to the treatments completely at random The model is of the form Response = Constant + effect of a block + effect of treatment + error
Designs with two or more blocking factors These involves two major sources of variation that have been designated as blocking factors. The model is of the form Response = Constant + effect of row block + effect of column block + effect of treatment + error
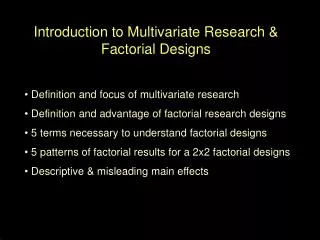
INTRODUCTION TO FACTORIAL DESIGNS • Experiments often involves several factors, and usually • the objective of the experimenter is to determine the • influence these factors have on the response. • Several approaches can be employed to deal when • faced with more than one treatments Best – guess Approach Experimenter select an arbitrary combinations of treatments, test them and see what happens
One - Factor - at - a - time (OFAT) • Consists of selecting a starting point, or baseline set of • levels, for each factor, and then successively varying • each factor over its range with the other factors held • constant at the baseline level.
The valuable approach to dealing with • several factors is to conduct a • FACTORIAL EXPERIMENT • This is an experimental strategy in which • factors are varied together, instead of one • at a time
In a factorial design, in each complete trial • or replicate of the experiment, all possible • combination of the levels of the factors • are investigated. e.g. If there are a levels of factor A and b levels of factor B, each replicate contains all ab treatment combinations The model is of the form Response = Constant + Effect of factor A + Effect of factor B + Interaction effect + Error term
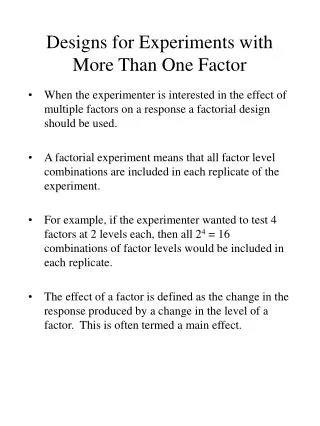
Consider the following example (adapted from Montgomery, 2013) of a two-factors (A and B) factorial experiment with both design factors at two levels (High and Low) B High A Low B High A High 30 52 B Low A Low B Low A High 20 40
Main effect : Change in response produced by a change in the level of a factor Factor A _ Main Effect = 40 + 52 20 + 30 2 2 = 21 ,Increasing factor A from low level to high level, causes an average response increase of 21 units Factor B = ? Main Effect
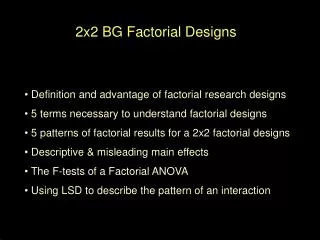
Interaction A High B High A Low B High 40 12 50 A Low B Low 20 A High B Low
At low level of factor B The A effect = 50 – 20 = 30 At high level of factor B The A effect = 12 - 40 = -28 The effect of A depends on the level chosen for factor B
“If the difference in response between the levels of one factor is not the same at all levels of the other factors then we say there is an interaction between the factors” (Montgomery 2013) The magnitude of the interaction effect is the average difference in the two factor A effects AB (-28 – 30) = 2 = -29 A effect 1 = In this case, factor A has an effect, but it depends on the level of factor B be chosen
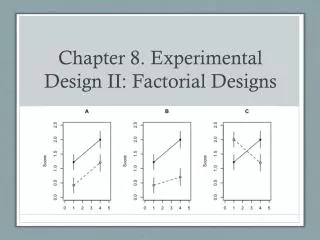
Interaction Graphically B High B High B Low Response Response B Low Low High Low High Factor A Factor A • A factorial experiment • without interaction • A factorial experiment with • interaction
Factorial designs has several advantages; • They are more efficient than One Factor at a Time • A factorial design is necessary when interactions • may be present to avoid misleading conclusions • Factorial designs allow the effect of a factor to be • estimated at a several levels of the other factors, • yielding conclusions that are valid over a range • of experimental conditions
The two factor Factorial Design • The simplest types of factorial design involves • only two factors. • There are a levels of factor A and b levels of • factor B, and these are arranged in a factorial • design. • There are n replicates, and each replicate of the • experiment contains all the ab combination.
Example An engineer is designing a battery for use in a device that will be subjected to some extreme variations in temperature. The only design parameter that he can select is the plate material for the battery. For the purpose of testing temperature can be controlled in the product development laboratory (Montgomery, 2013) Life (in hours) Data Temperature Material Type 15 70 125 130 74 150 159 138 168 155 180 188 126 110 160 34 80 136 106 174 150 40 75 122 115 120 139 20 82 25 58 96 82 70 58 70 45 104 60 1 2 3
The design has two factors each at three levels and is • then regarded as 32 factorial design. • The design is a completely Randomized Design The engineer wants to answer the following questions; 1. What effects do material type and temperature have on the life of the battery? 2 .Is there a choice of material that would give uniformly long life regardless of temperature? • Both factors are assumed to be fixed, • hence we have a fixed effect model
Analysis of Variance for Battery life (in hours) Source DFSeq SSAdj SS Adj MS F P-value Material Type 2 10683.7 10683.7 5341.9 7.91 0.002 Temperature 2 39118.7 39118.7 19559.4 28.97 0.000 Material Type*Temperature 4 9613.8 9613.8 2403.4 3.56 0.019 Error 27 18230.7 18230.7 675.2 Total 35 77647.0 We have a significant interaction between temperature and material type.
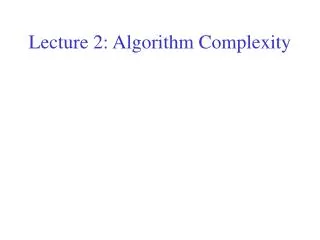
Interaction plot Significant interaction is indicated by the lack of parallelism of the lines,Longer life is attained at low temperature, regardless Of material type
The General Factorial Design • The results for the two – factor factorial • design may be extended to the general • case where there are a levels of factor A, • b levels of factor B, c levels of factor C, • and so on, arranged in a factorial • experiment.
Sometimes, it is not feasible or practical • to completely randomize all of the runs • in a factorial. • The presence of a nuisance factor may • require that experiment be run in blocks. The model is of the form Response = Constant + Effect of factor A + Effect of factor B + interaction effect + Block Effect + Error term
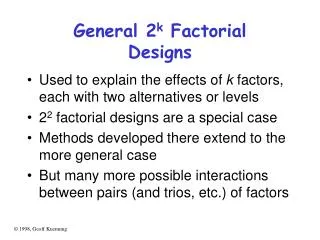
The 2K Factorial designs • This is a case of a factorial design with K factors, each • at only two levels. • These levels may be quantitative or qualitative. • A complete replicate of this design requires • 2K observation and is called 2K factorial design. Assumptions 1. The factors are fixed. 2. The designs are completely randomized. 3. The usual normality assumptions are satisfied.
The design with only two factors each at two levels is • called 22 factorial design • The levels of the factors may be arbitrarily called • “Low” and “High” Factor A B Treatment Combination - + - + - - + + A Low, B Low A High, B Low A Low, B High A High, B High (1) a b ab The order in which the runs are made is a completely randomized experiment
The four treatment combination in the design can be • represented by lower case letters • The high level factor in any treatment combination is • denoted by the corresponding lower case letter • The low level of a factor in a treatment combination is • represented by the absence of the corresponding letter • The average effect of a factor is the change in the • response produced by a change in the level of that • factor averaged over the levels of the other factor
The symbols (1), a, b, ab represents the total • of the observation at all n replicates • taken at a treatment combination A main effect = 1/2n[ab + a – b – (1)] B main effect = 1/2n[ab +b - a – (1)] AB effect = 1/2n{[ab + (1) – a – b]
In experiments involving 2K designs, it is • always important to examine the magnitude • anddirectionof the factor effect to determine • which factors are likely to be important • Effect Magnitude and direction should always • be considered along with ANOVA, because the • ANOVA alone does not convey this information
We define; Contrast A = ab + a – b – (1) = Total effect of A • We can write the treatment combination in the order • (1), a, b, ab. Also called the standard order (or Yates order) Factorial Effect Treatment Combination I A B AB (1) a b ab + +++ - + - + - - ++ + - - + The above is also called the table of plus and minus signs
Suppose that three factors, A ,B and C, each at two levels • are of interest. The design is referred as 23 factorial design Treatment Combination Factorial Effects I A B AB C AC BC ABC - ++ - + - - + (1) a b ab c ac bc abc ++++++++ - + - + - + - + - - ++ - - + + + - - + + - - + - - - - ++++ + - + - - + - + ++- - - - ++ A contrast = [ab + a + ac + abc – (1) – b – c - bc B contrast = ?
In General; • The design with K factors each at two levels is • called a 2K factorial design • The treatment combination are written in • standard order using notation introduced • in a 22 and 23 designs
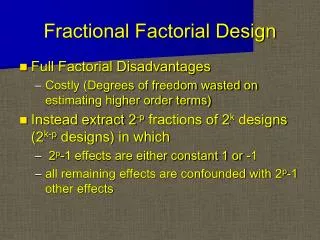
A single replicate of the 2K Designs • For even a moderate number of factors, the total number of • treatment combinations in a 2K factorials designs is large. • 25 design has 32 treatment combinations • 26 design has 64 treatment combinations • Resources are usually limited, and the number of replicates that • the experimenter can employ may be restricted • Frequently, available resources only allow a single replicate of the • design to be run, unless the experimenter is willing to omit some • of the original factors
An analysis of an unreplicated factorials assume • that certain high –order interaction are negligible • and combine their means squares to estimate the • error • This is an appeal to sparsity of effect principle, • that is most systems are dominated by some of • the main effect and low – order interactions, and • most high – order interactions are negligible • When analyzing data from unreplicated factorial • designs, its is suggested to use normal probability • plot of estimates of the effects
Example A chemical product is produced in a pressure vessel. A factorial experiment is carried out in the pilot plant to study the factors thought to influence filtration rate of this product. The four factors are Temperature (A), pressure (B), concentration of formaldehyde (C), and string rate (D). Each factor is present at two levels. The process engineer is interested in maximizing the filtration rate. Current process gives filtration rate of around 75 gal/h. The process currently uses the factor C at high level. The engineer would like to reduce the formaldehyde concentration as much as possible but has been unable to do so because it always results in lower filtration rates (Montgomery, 2013)